Where it hurt.
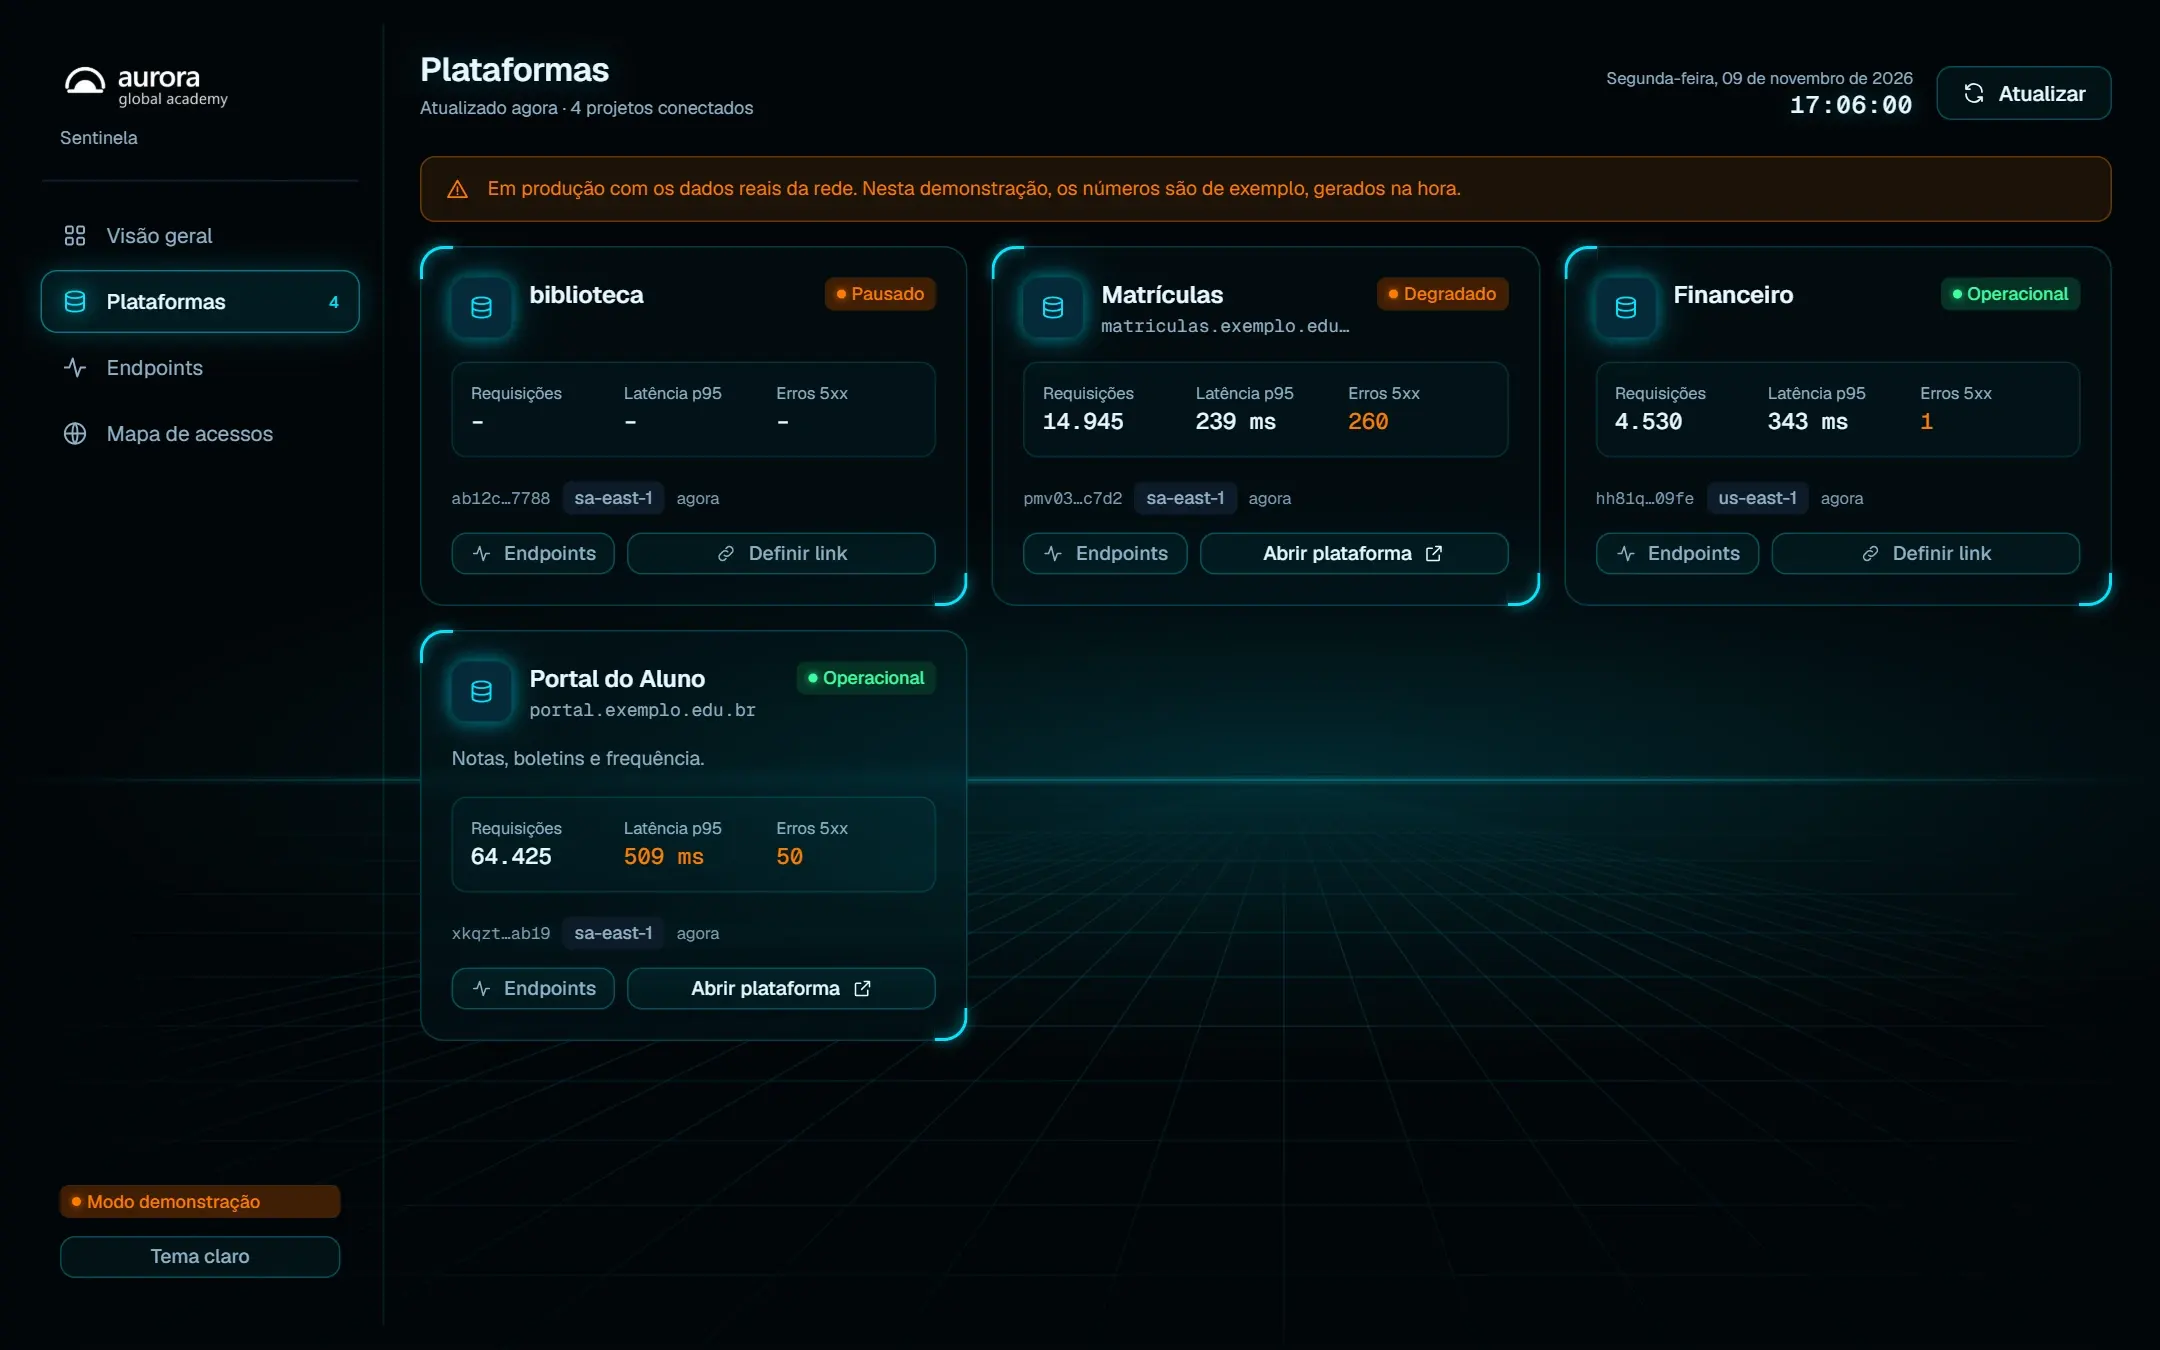
Several databases, each with its own dashboard. To know if something was down, or where suspicious traffic was coming from, you had to open project after project. Nobody had the full picture.
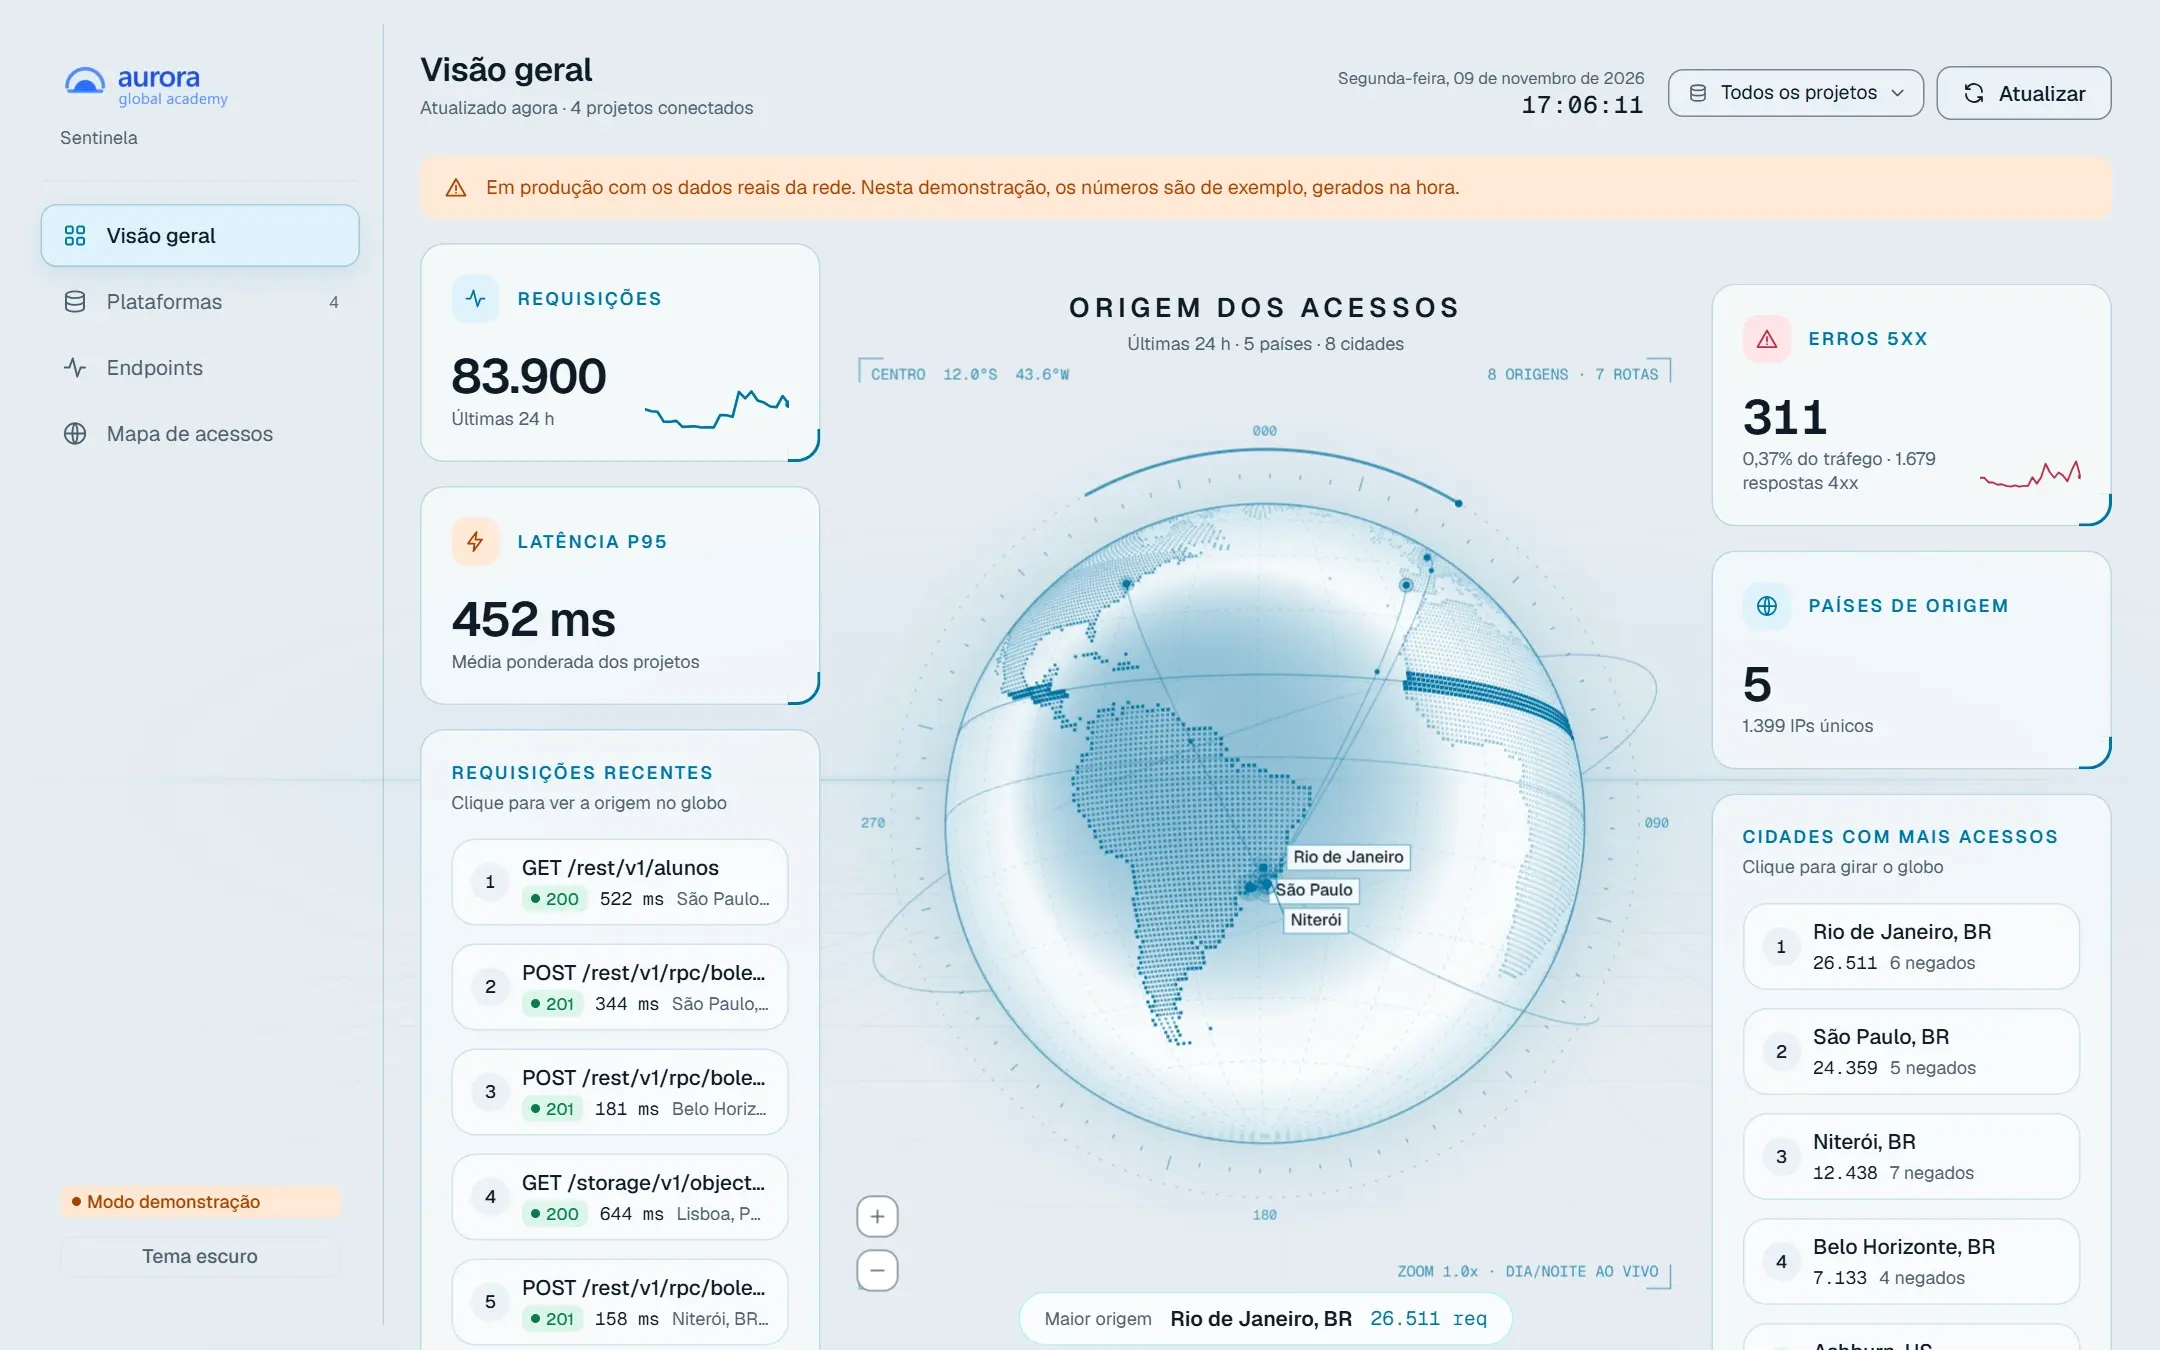
The school network runs several PostgreSQL databases and could only see each one's traffic by opening its own dashboard. Sentinela brings it all into one control center: a single token, one query per database and a globe that shows where the traffic comes from.
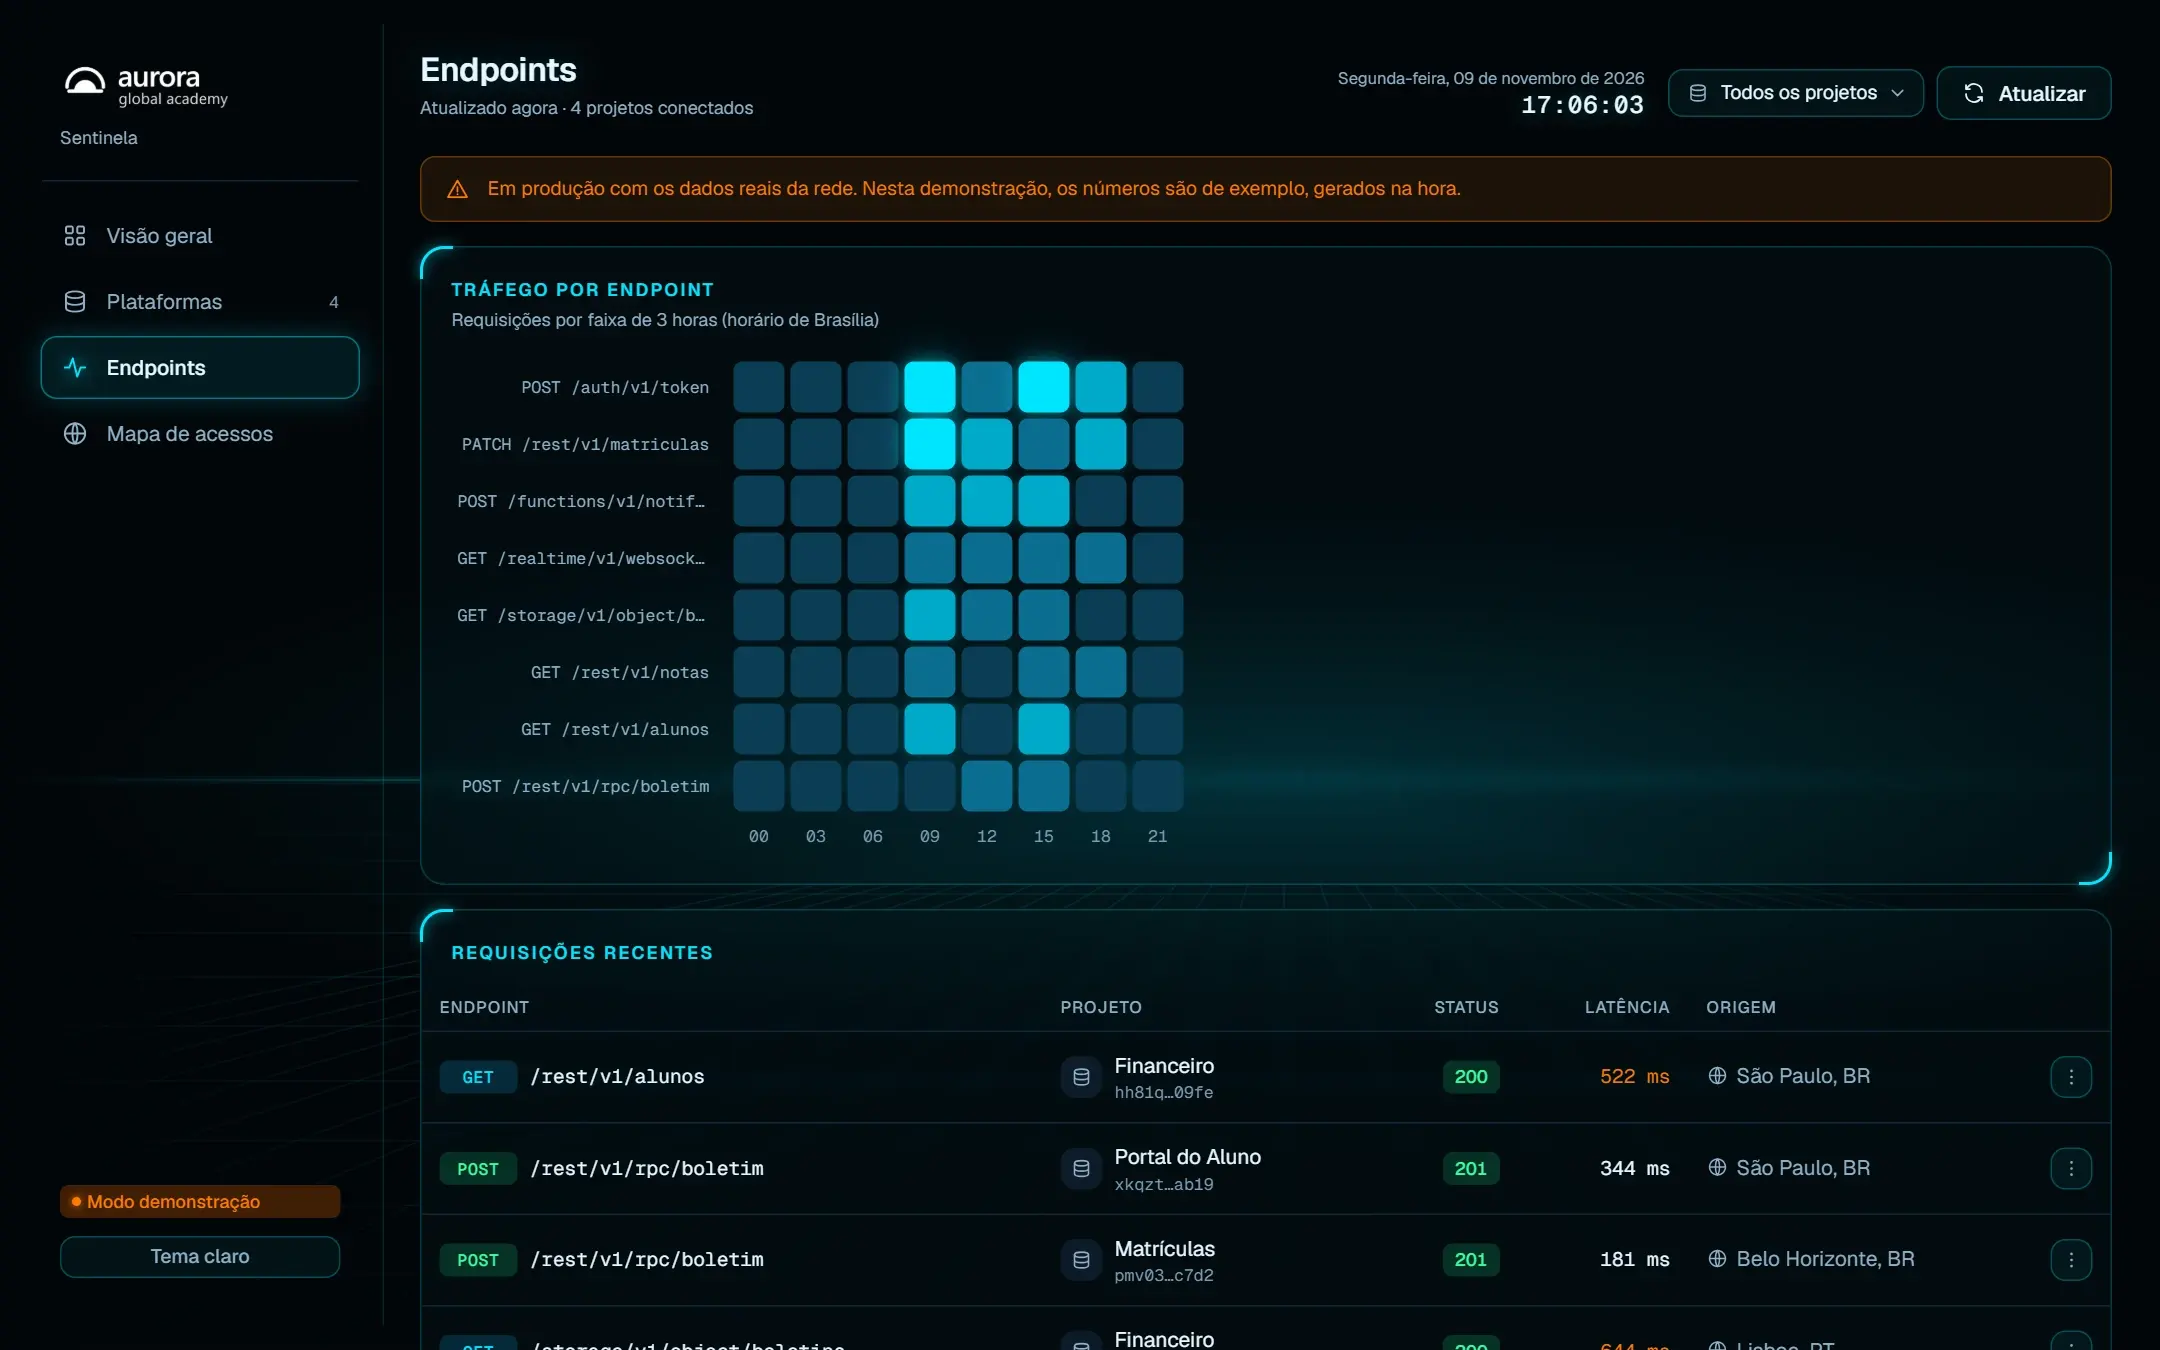
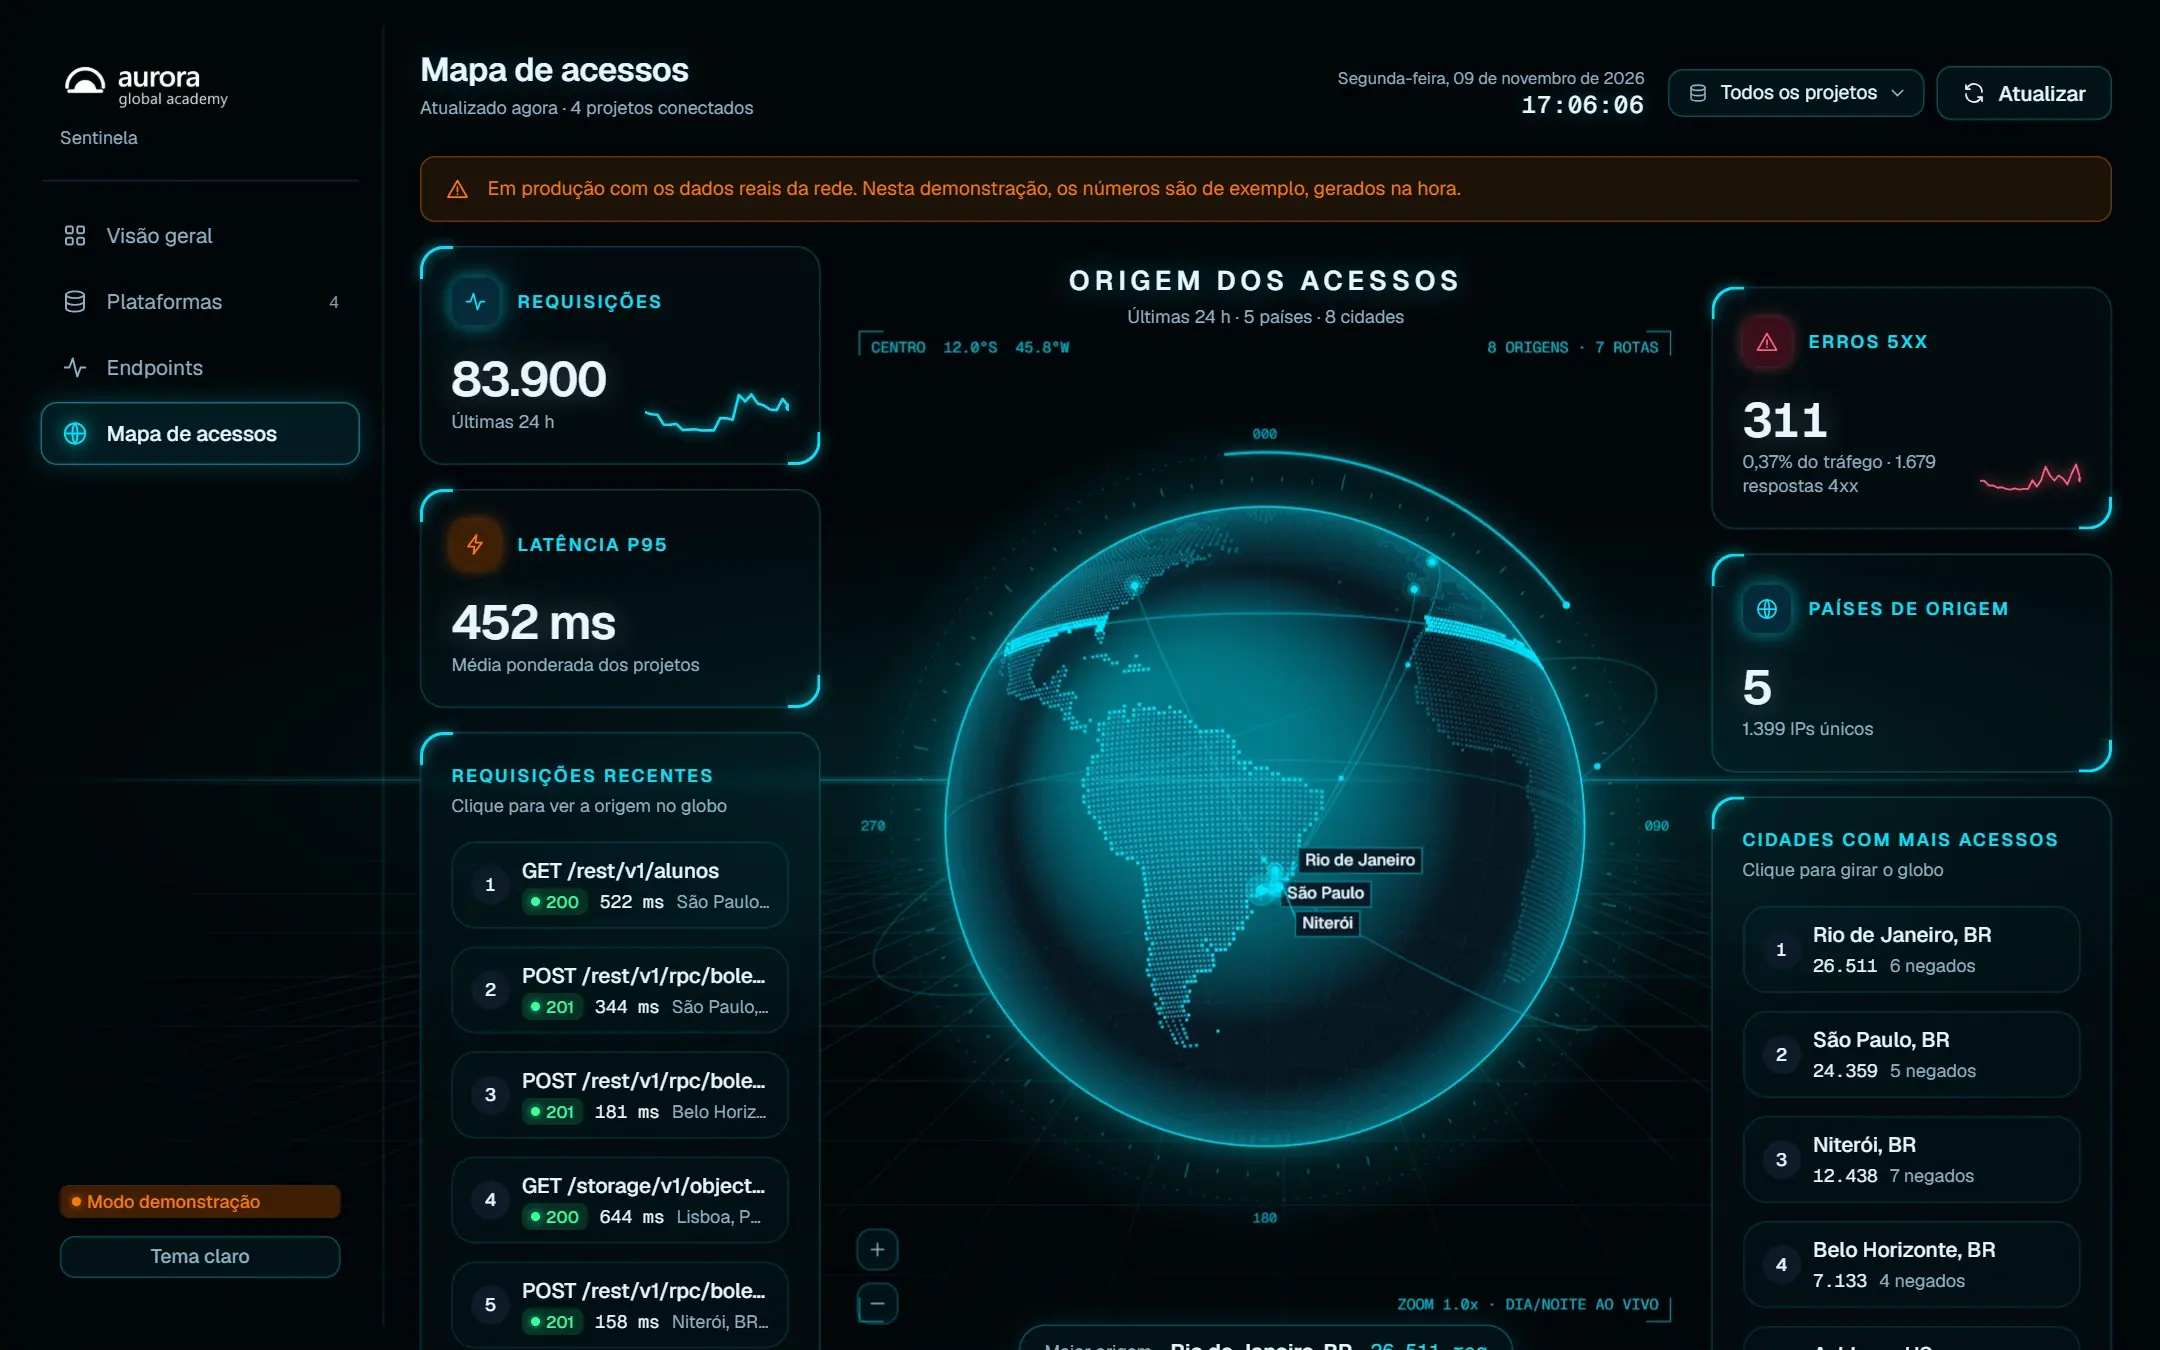
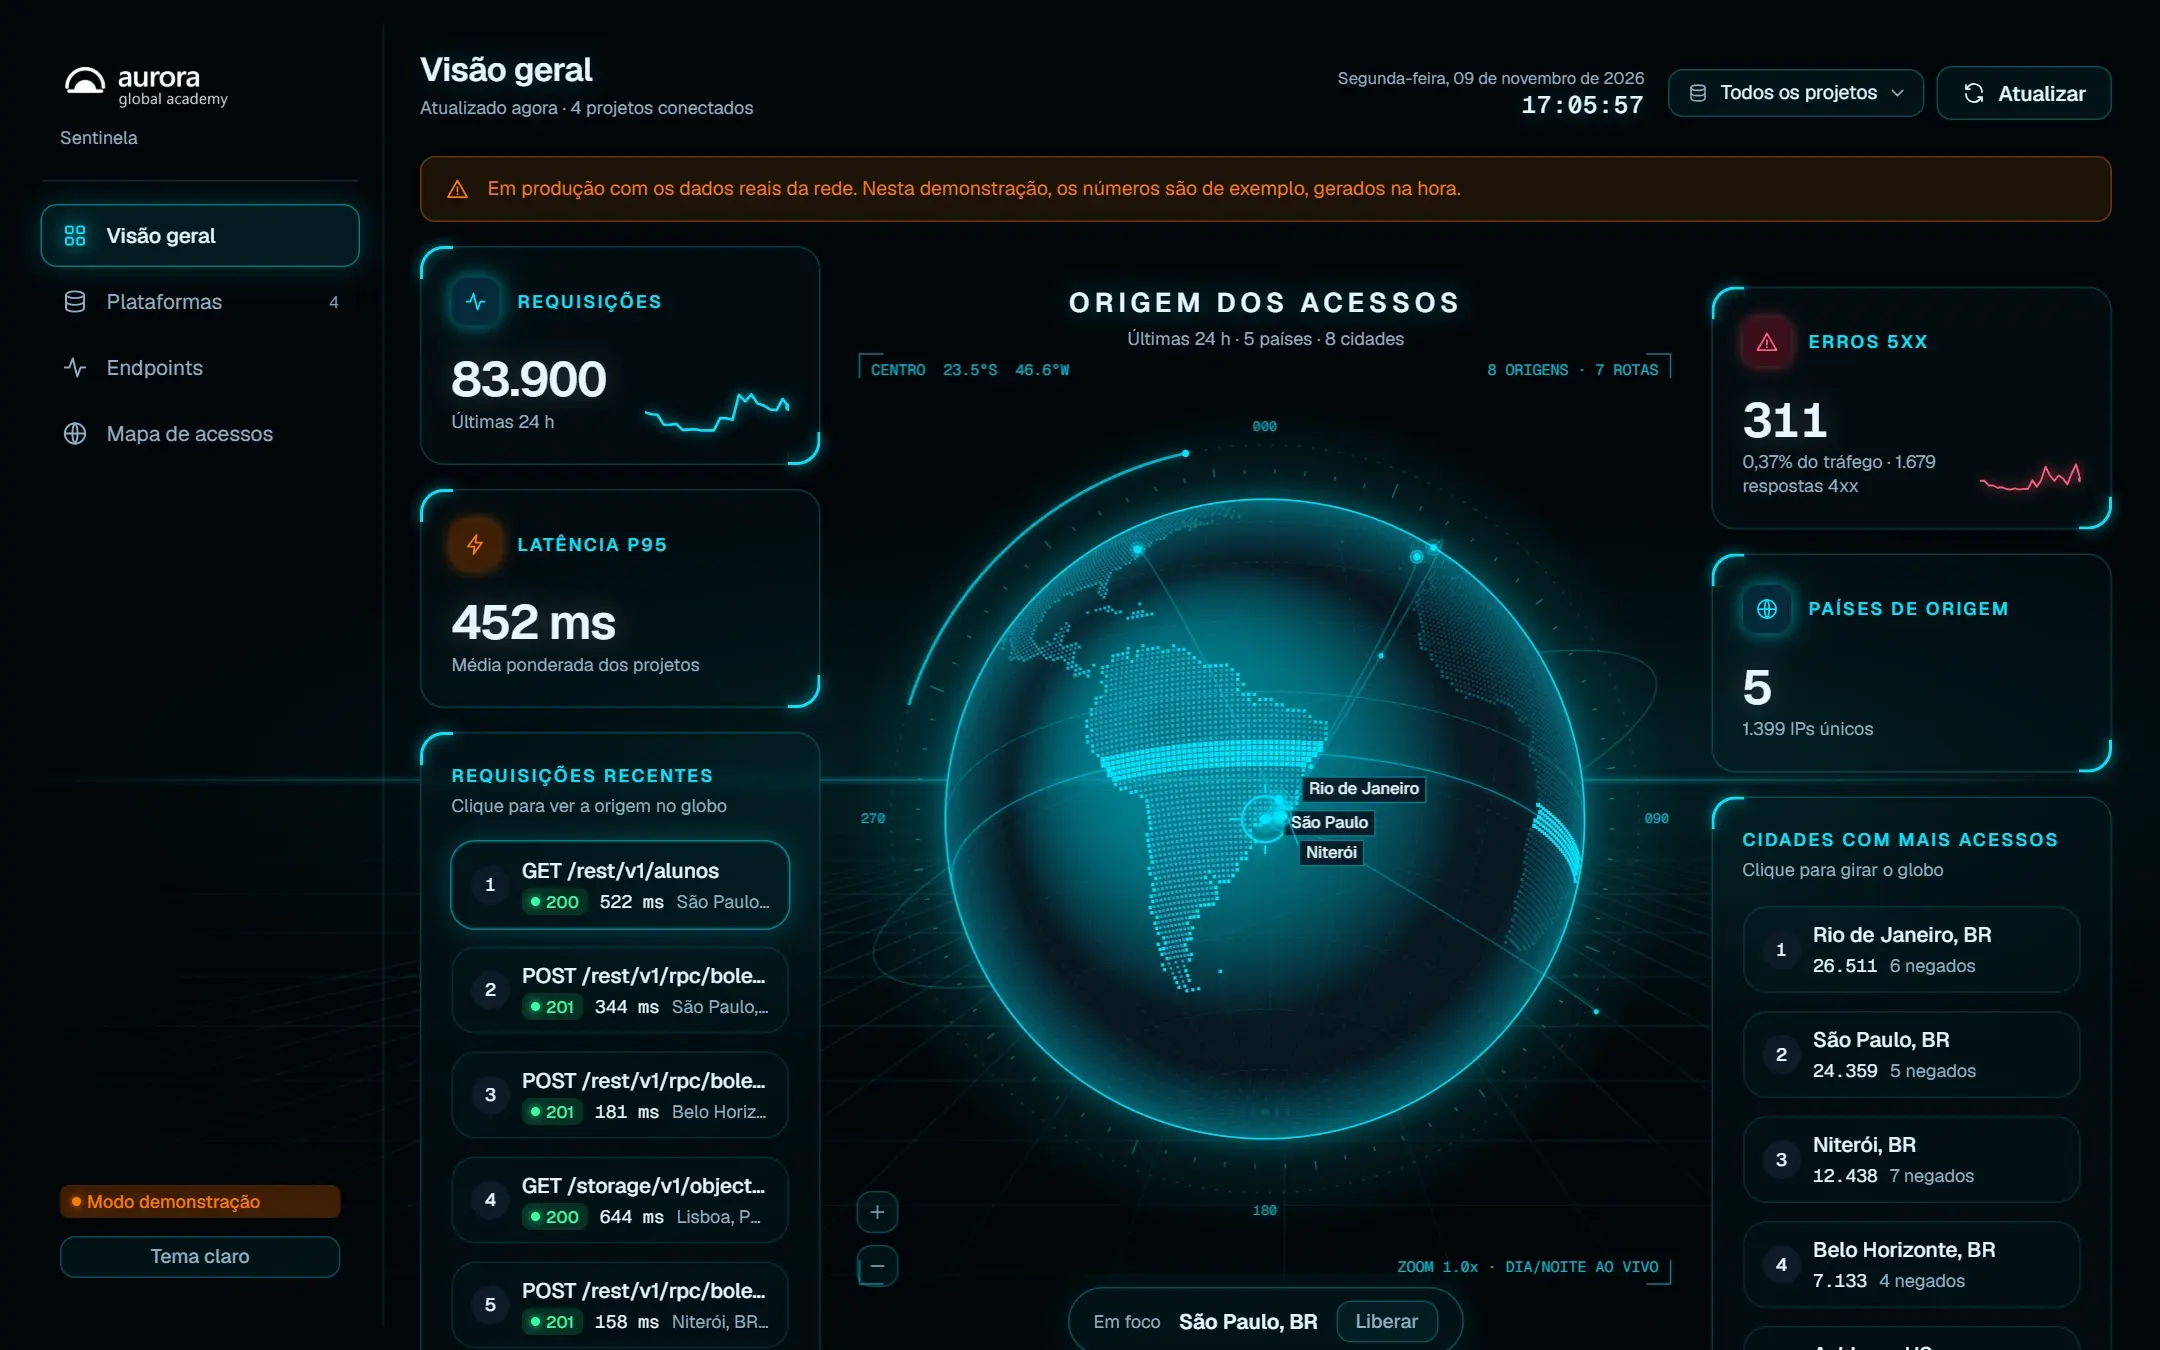
System in production, on real data. On these screens, names, faces, emails, phone numbers and scores were replaced with sample data to protect the people who use the system. The look and the behavior are exactly those of production.
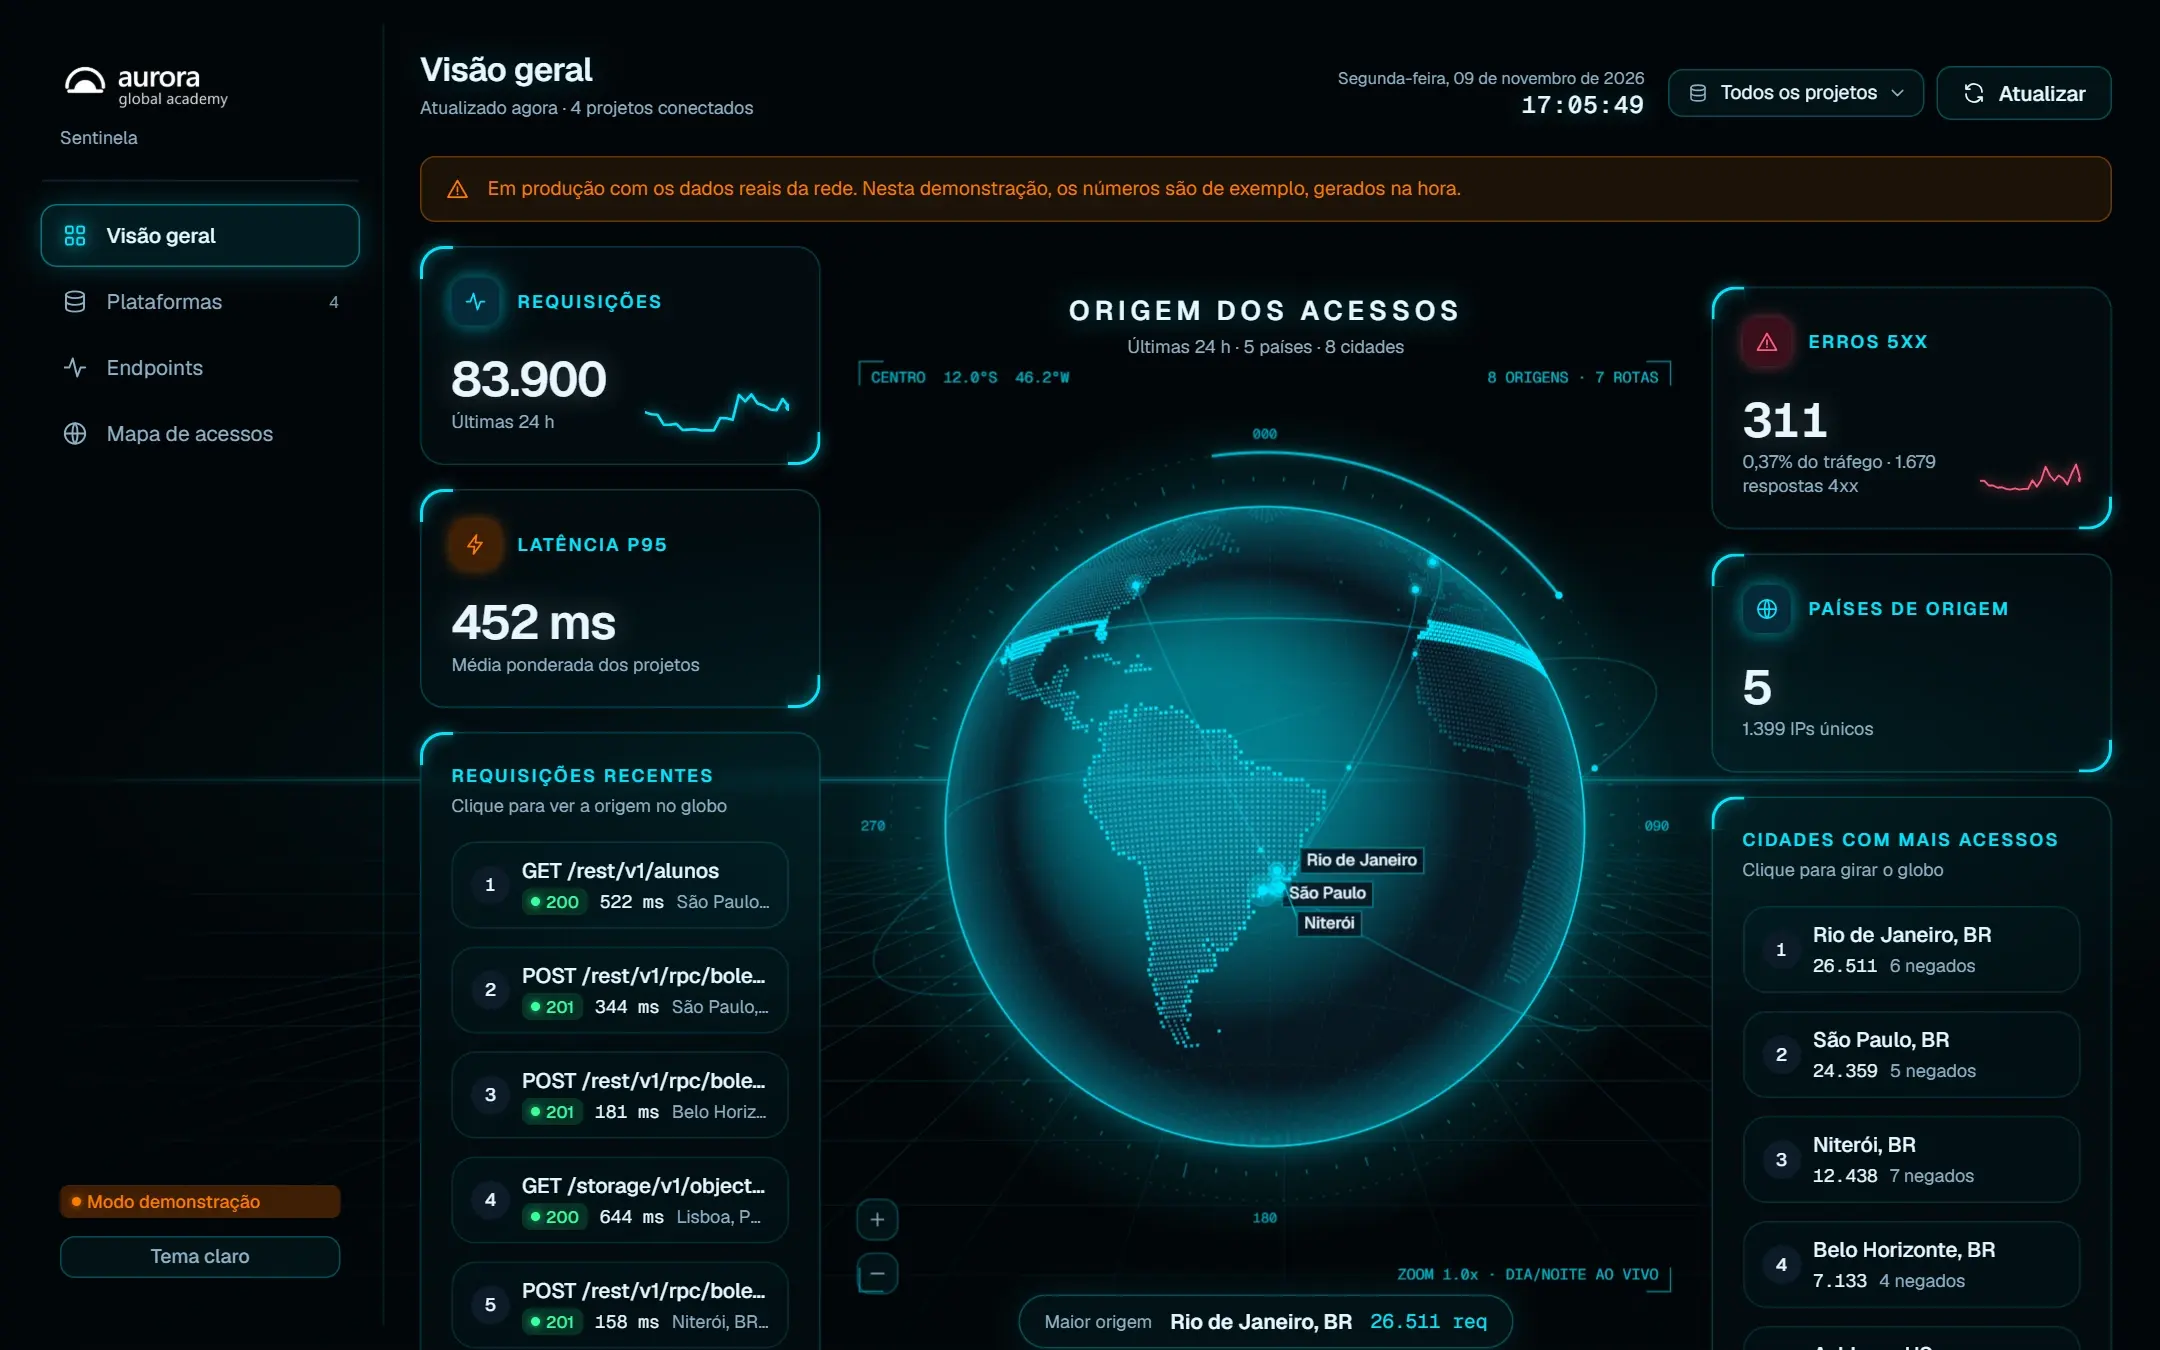
Requests, latency, errors and countries of origin around the globe, which spins on its own and marks the cities with the most traffic.
Several databases, each with its own dashboard. To know if something was down, or where suspicious traffic was coming from, you had to open project after project. Nobody had the full picture.
A lightweight server on cloud hosting lists the organization's projects with a single read token and runs one SQL query per project over the last 24 hours of logs, with a 60-second cache. The dashboard is a single lightweight file, in React with its own design system and a globe drawn in Canvas 2D that spins to the origin of each access.
A control center that opens in seconds and refreshes every minute, highlighting endpoints with errors, high latency and suspicious origins. In production, it reads the network's real data; here, the same dashboard runs on sample data to protect that information.
Tell me about today's problem. You get an answer within one business day.