Where it hurt.
Leadership had no consolidated view of what was late, which track concentrated the risk or at which stage materials were getting stuck.
The school network reviews and rewrites hundreds of teaching materials for the following year, with dozens of people in charge and a fixed print date. Tracking lived in a spreadsheet with one tab per school level.
System in production, on real data. On these screens, names, faces, emails, phone numbers and scores were replaced with sample data to protect the people who use the system. The look and the behavior are exactly those of production.
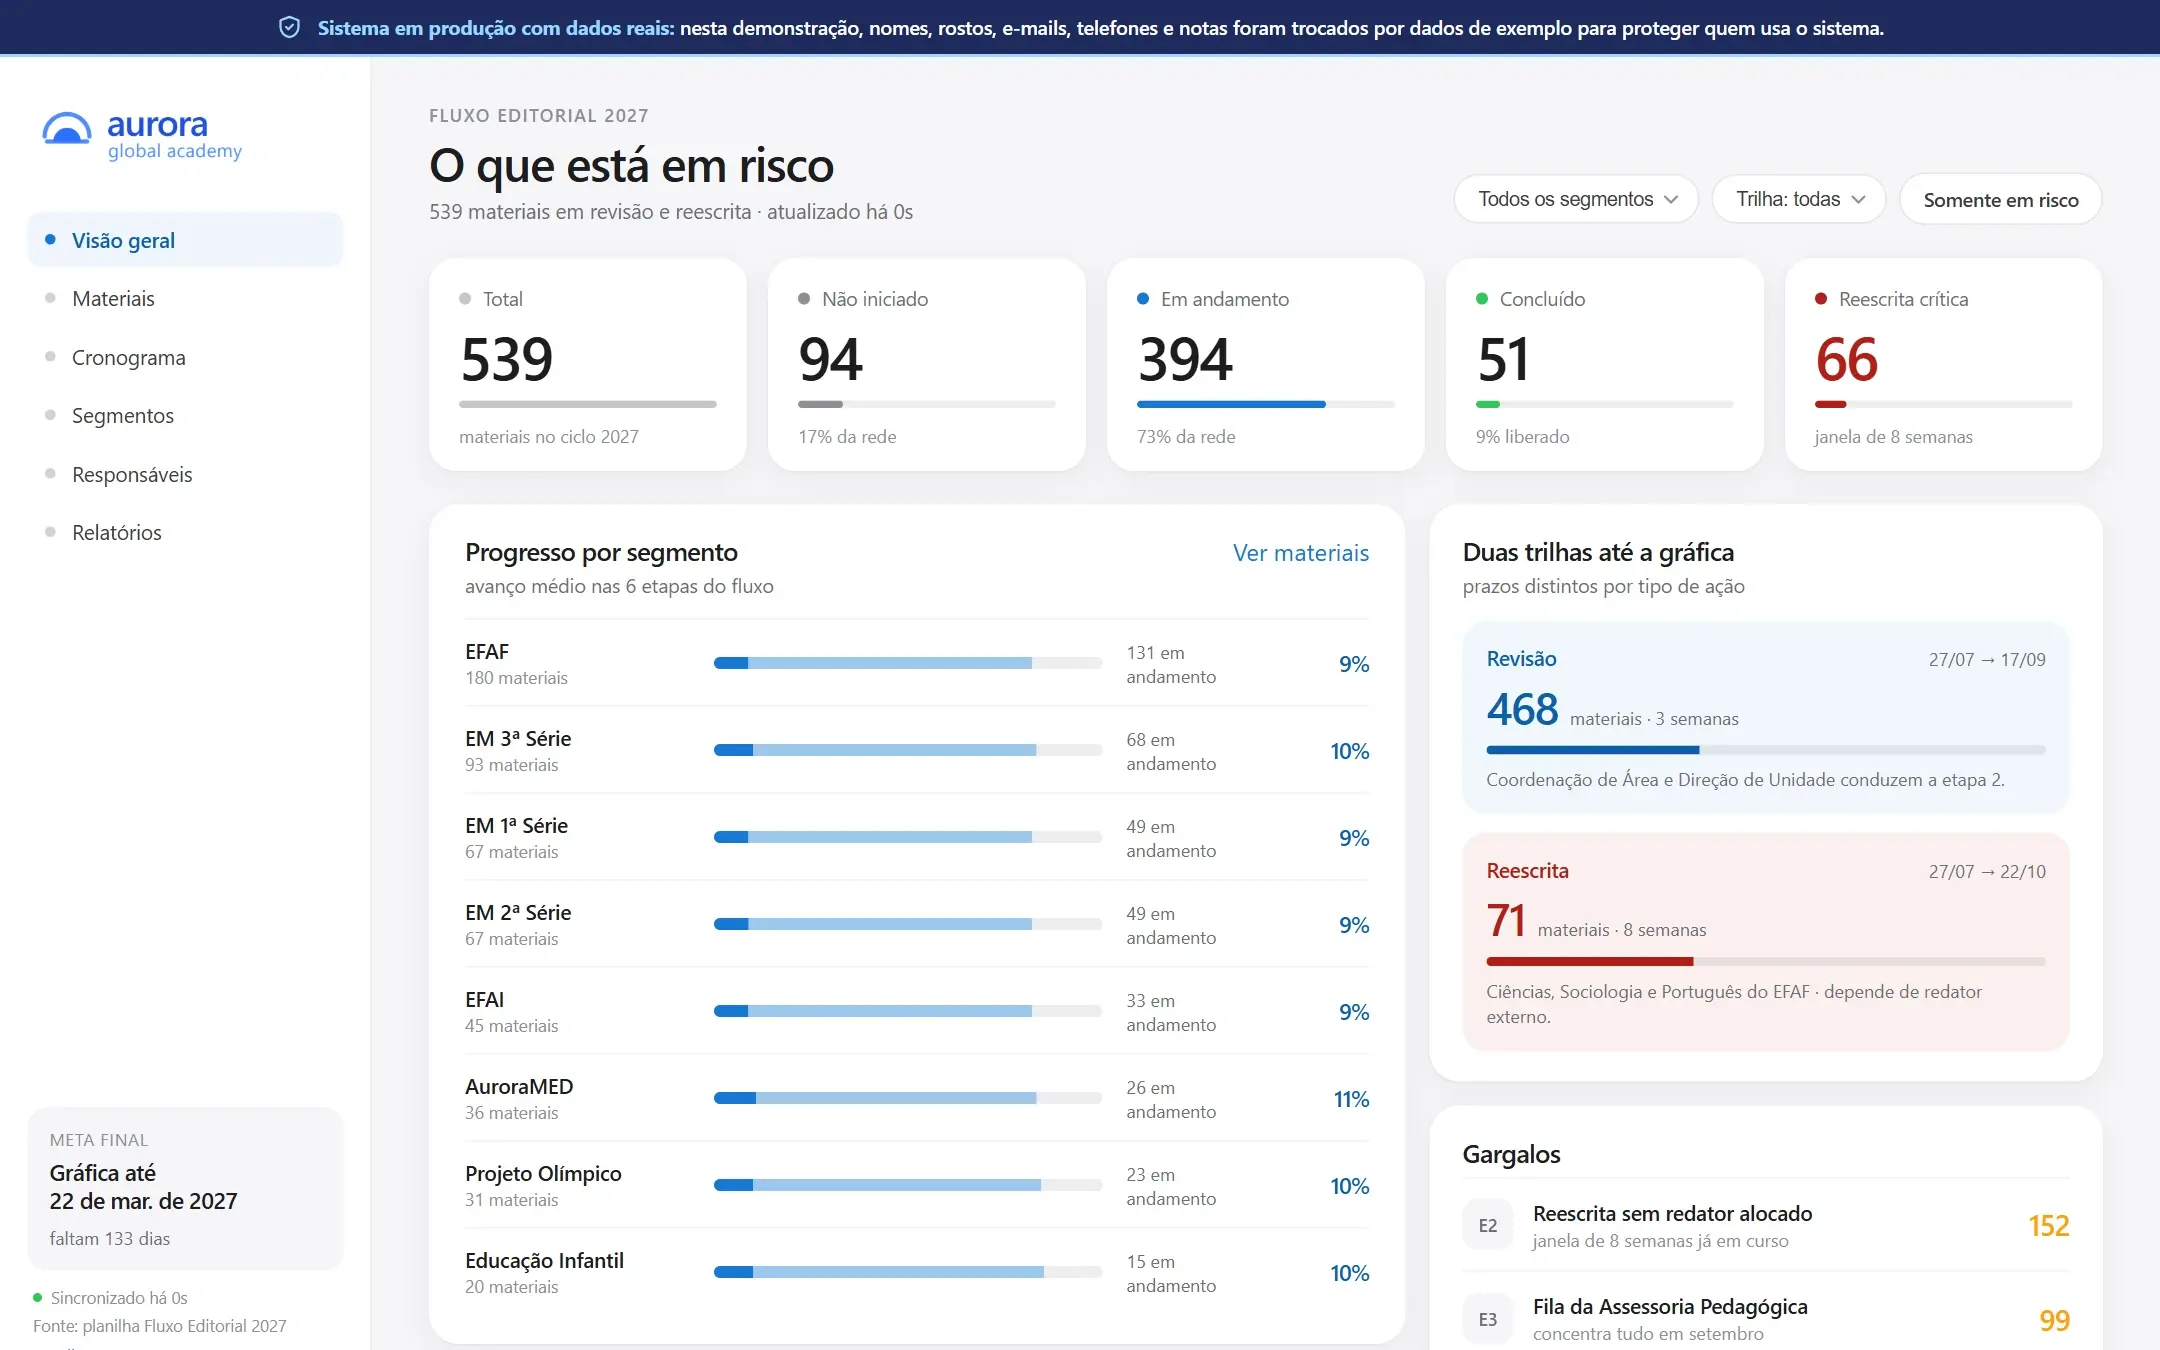
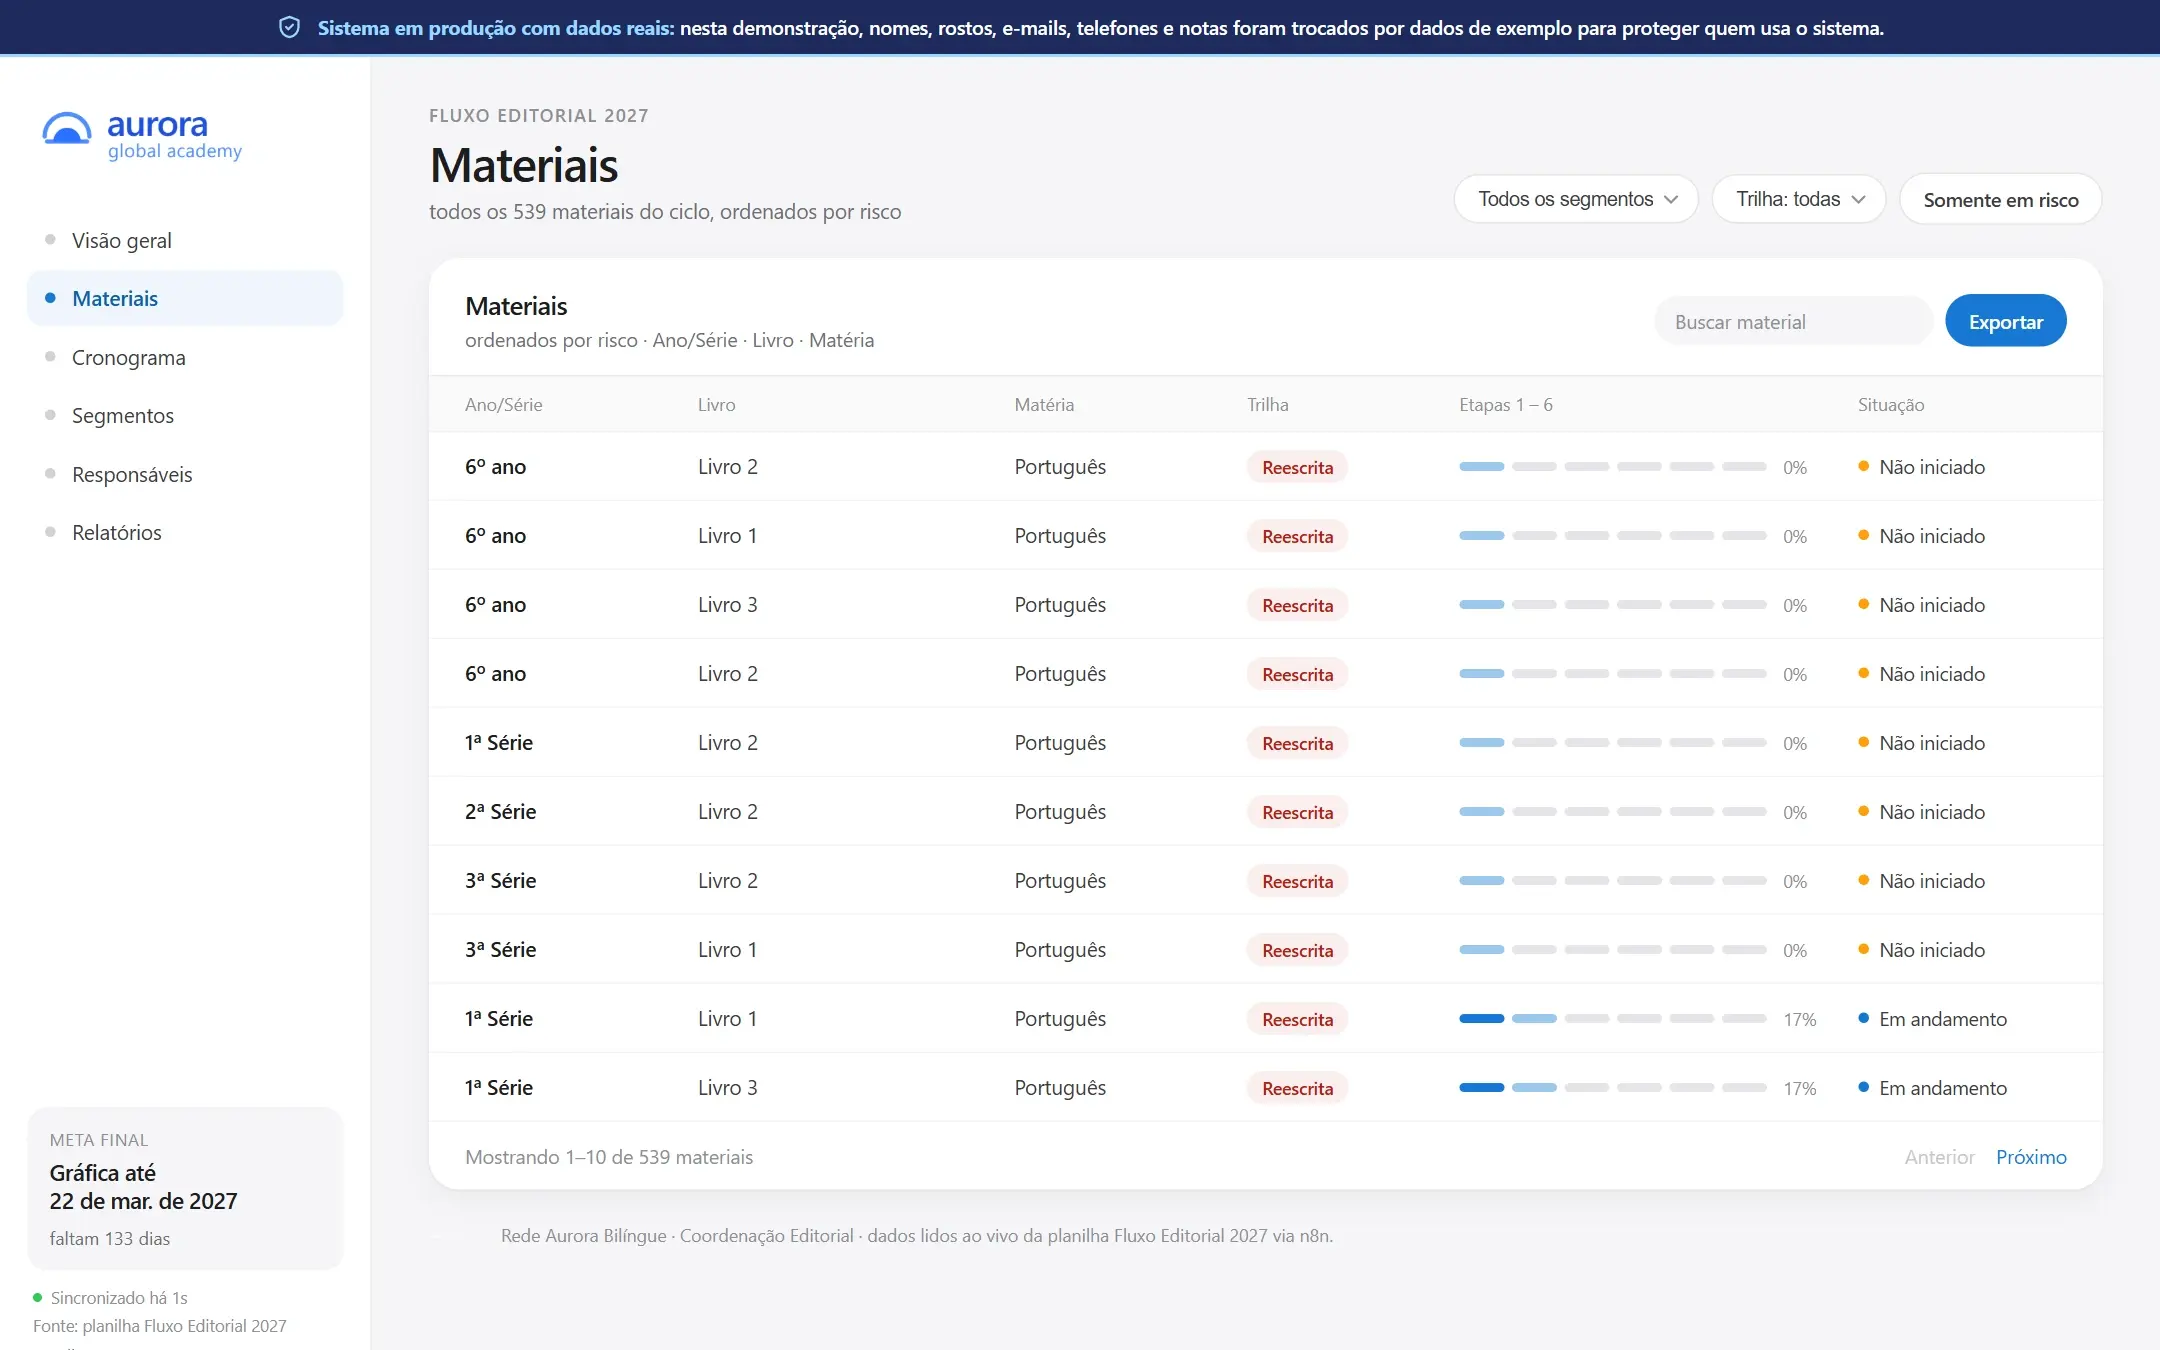
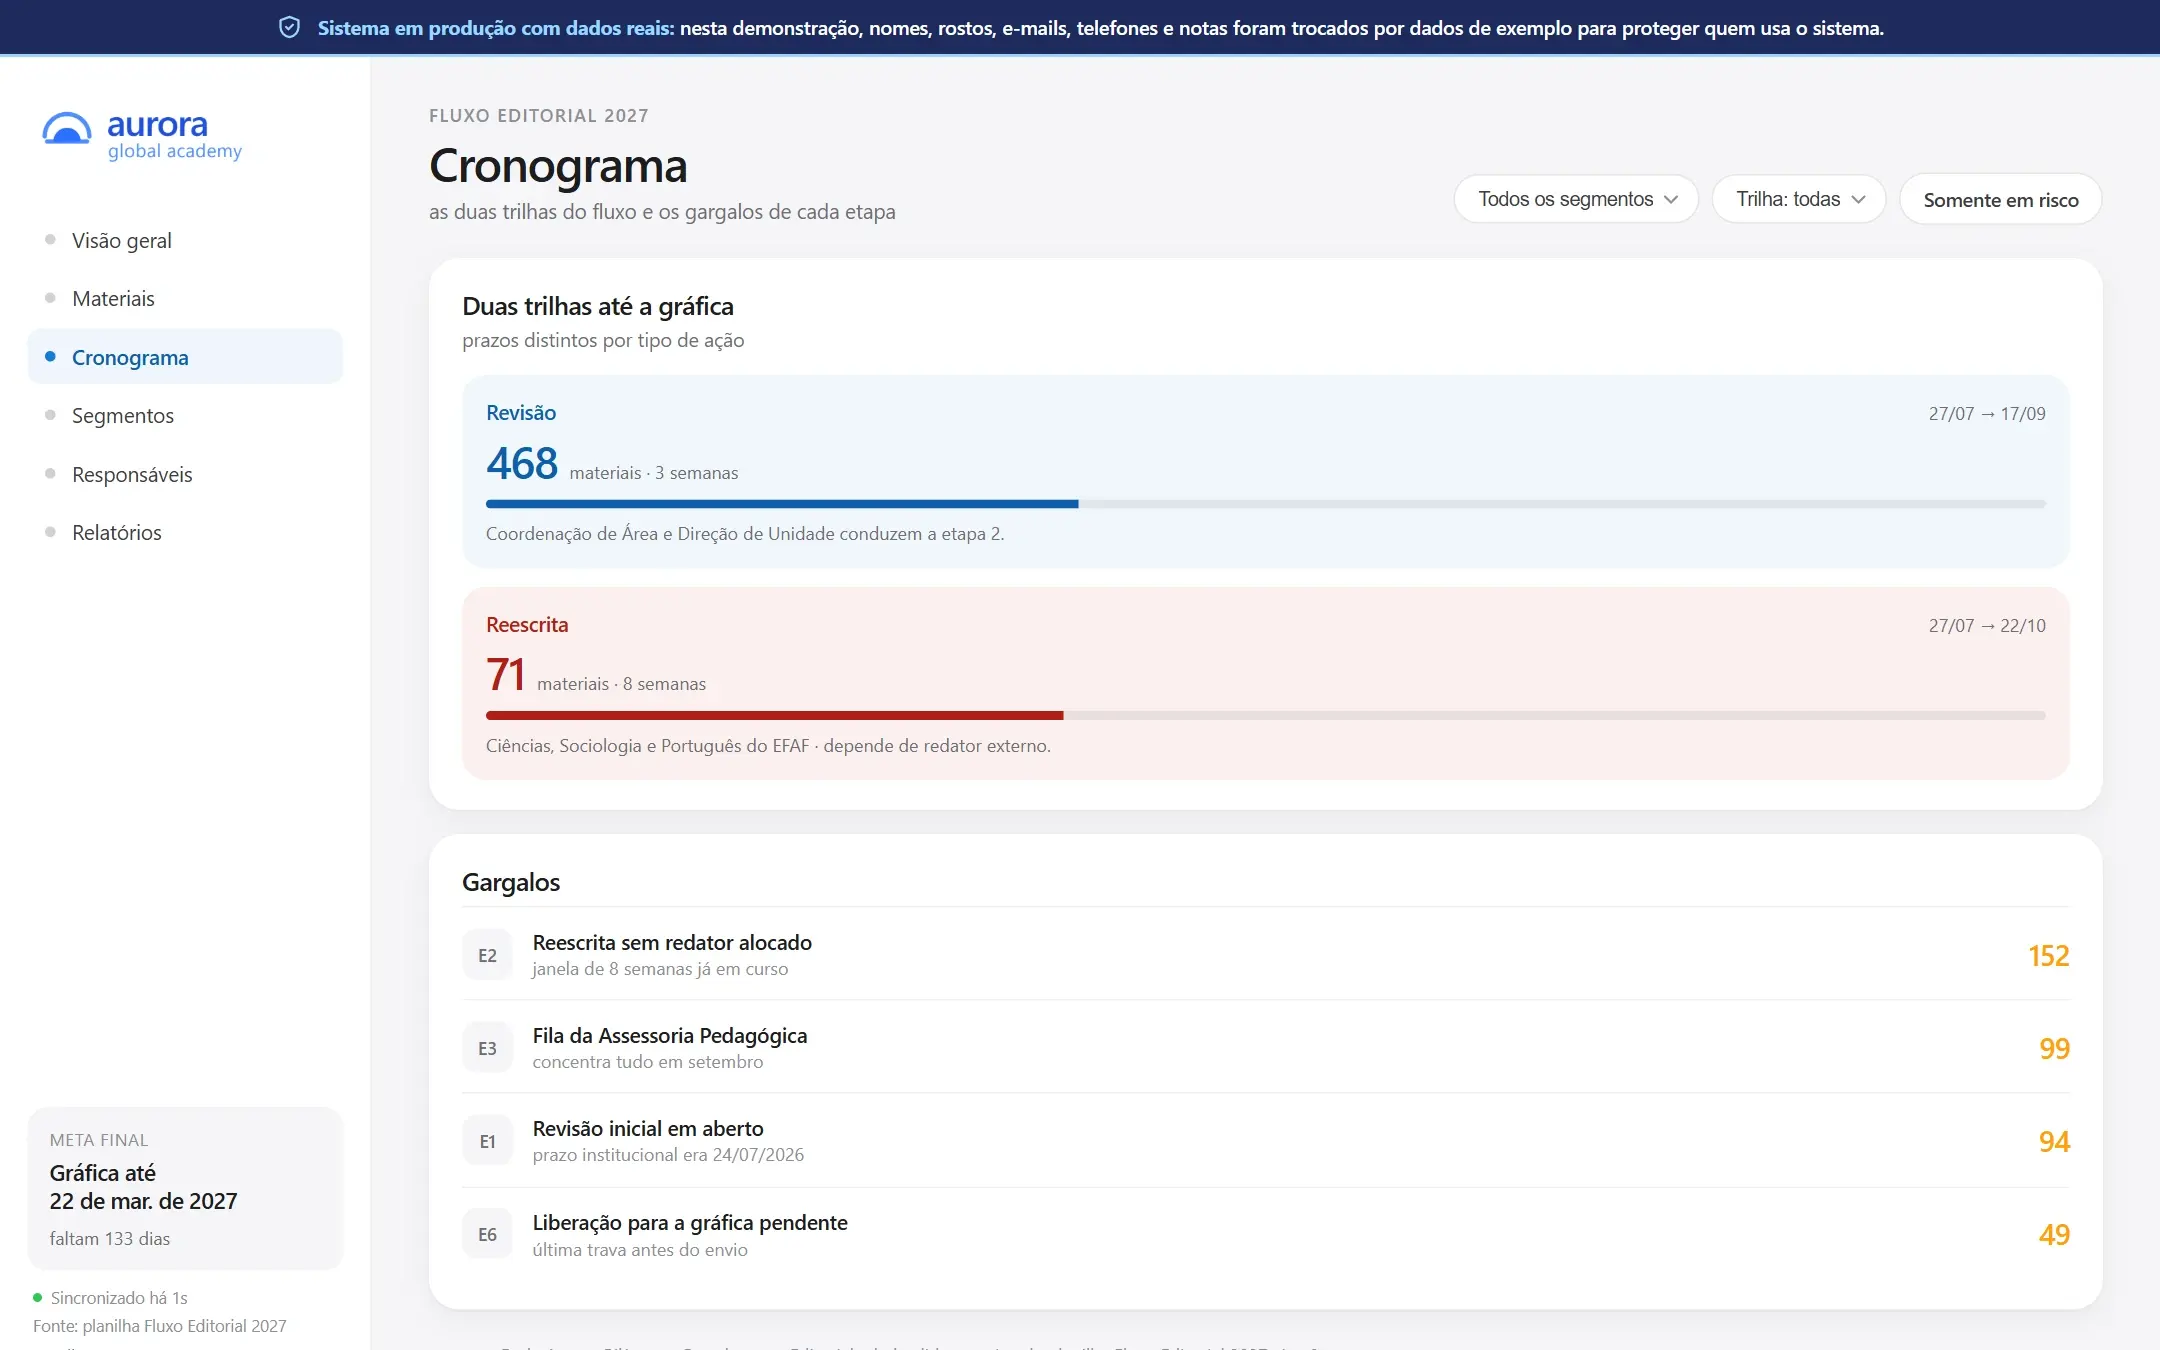
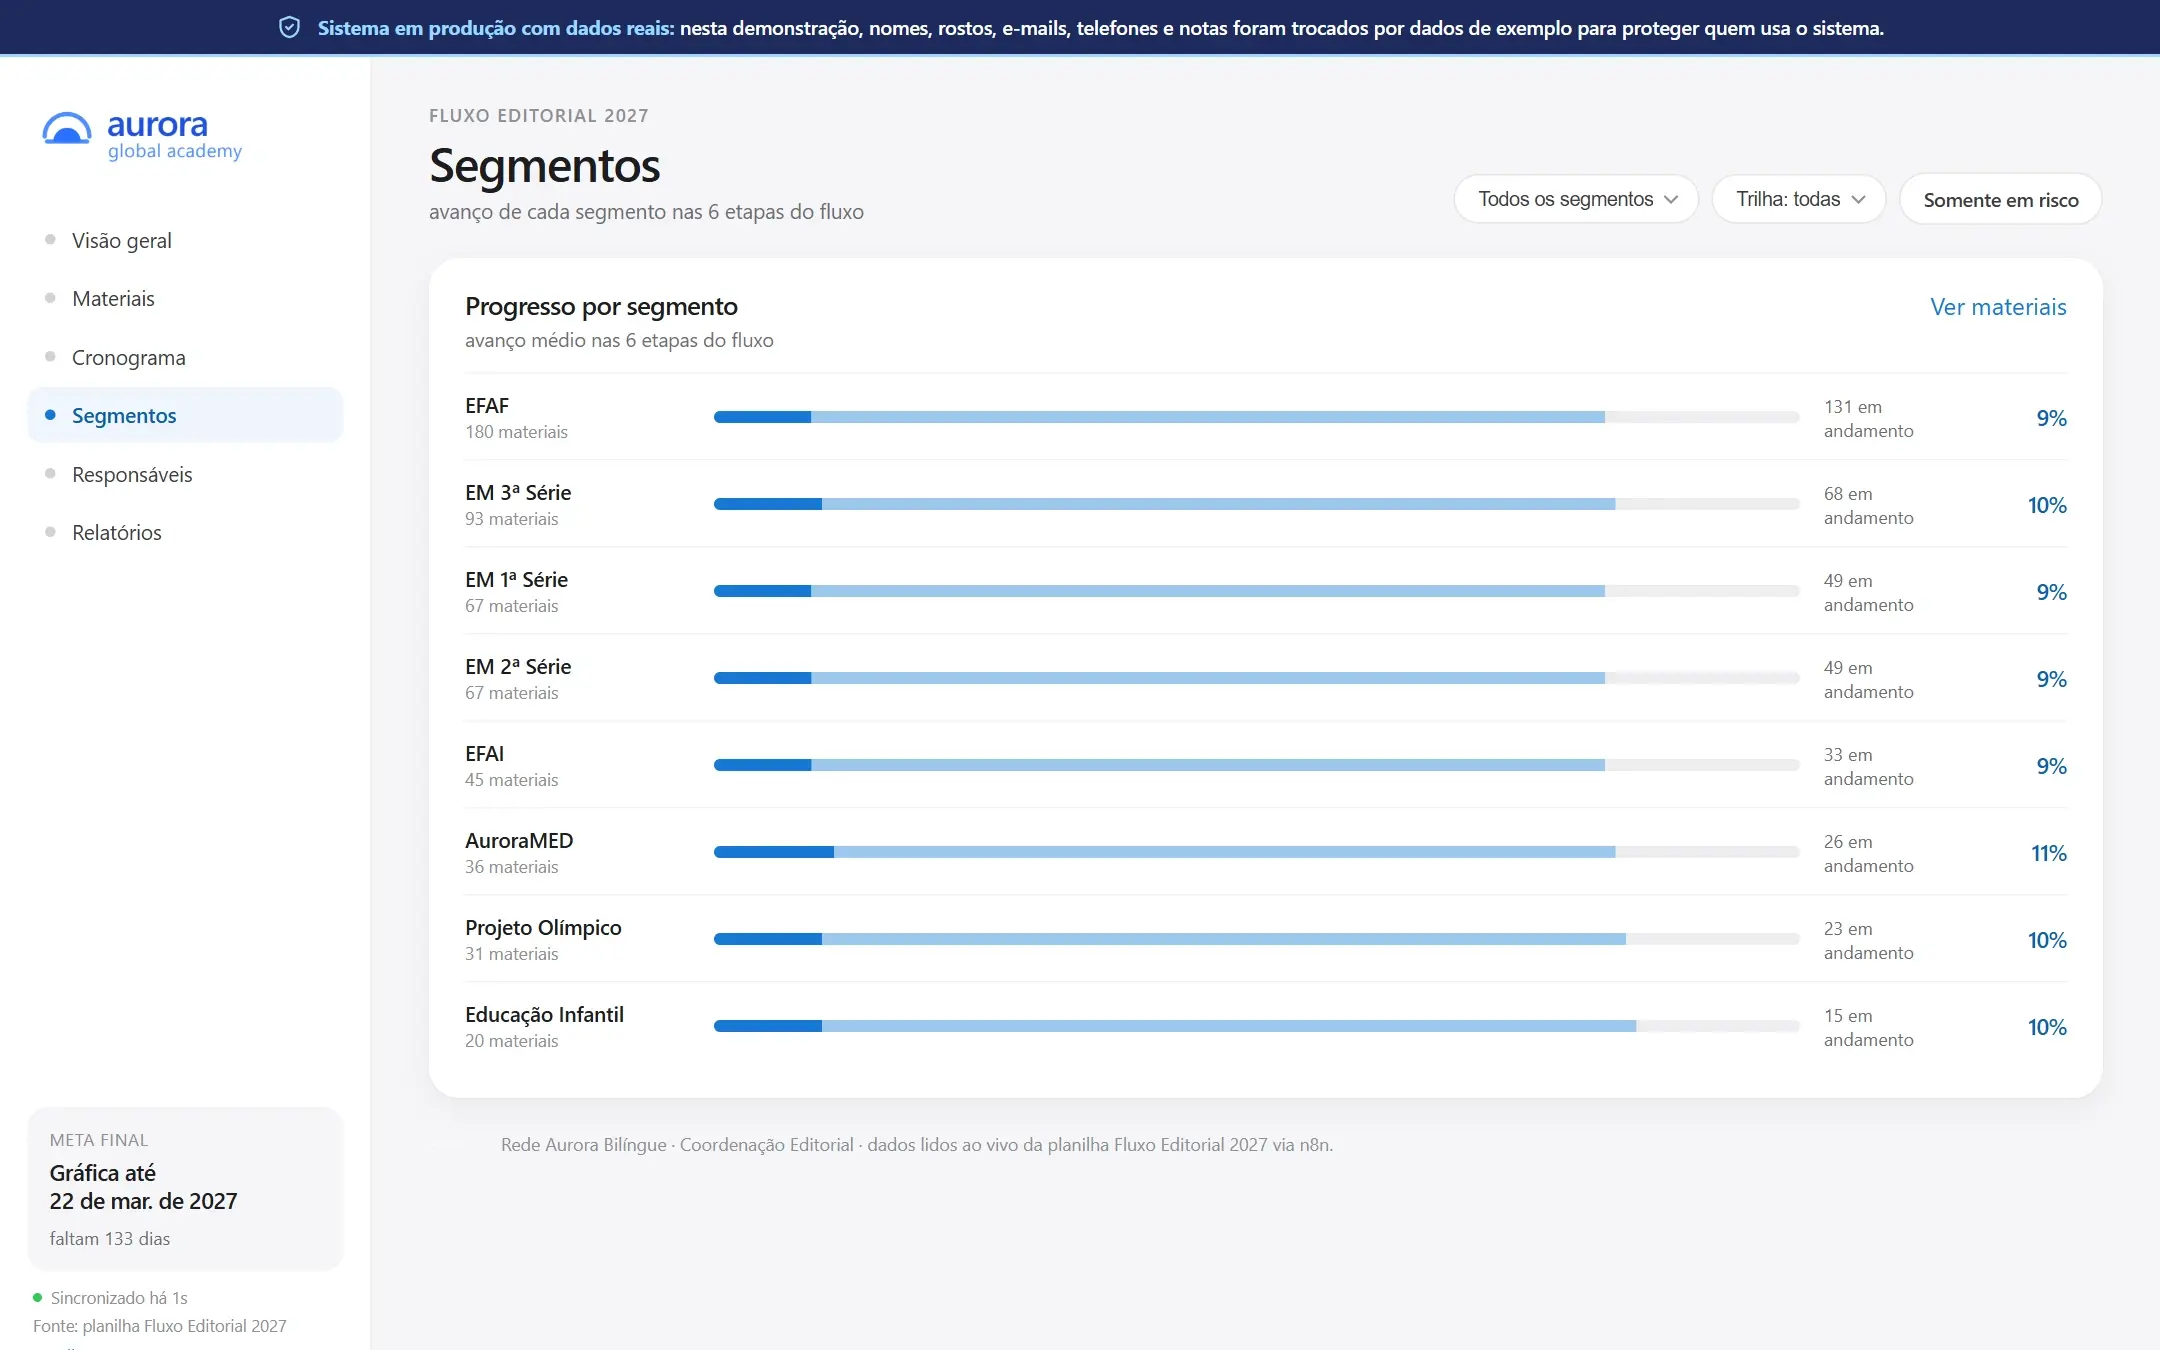
Indicators, progress by school level, the two tracks up to printing and the bottlenecks, on a single screen.
Leadership had no consolidated view of what was late, which track concentrated the risk or at which stage materials were getting stuck.
An executive dashboard served by n8n itself, which reads the spreadsheet through the Google Sheets API on every request, discovers tabs and columns from the header, calculates indicators, tracks, bottlenecks and risk, and delivers a JSON that the screen only has to draw. It refreshes on its own every minute.
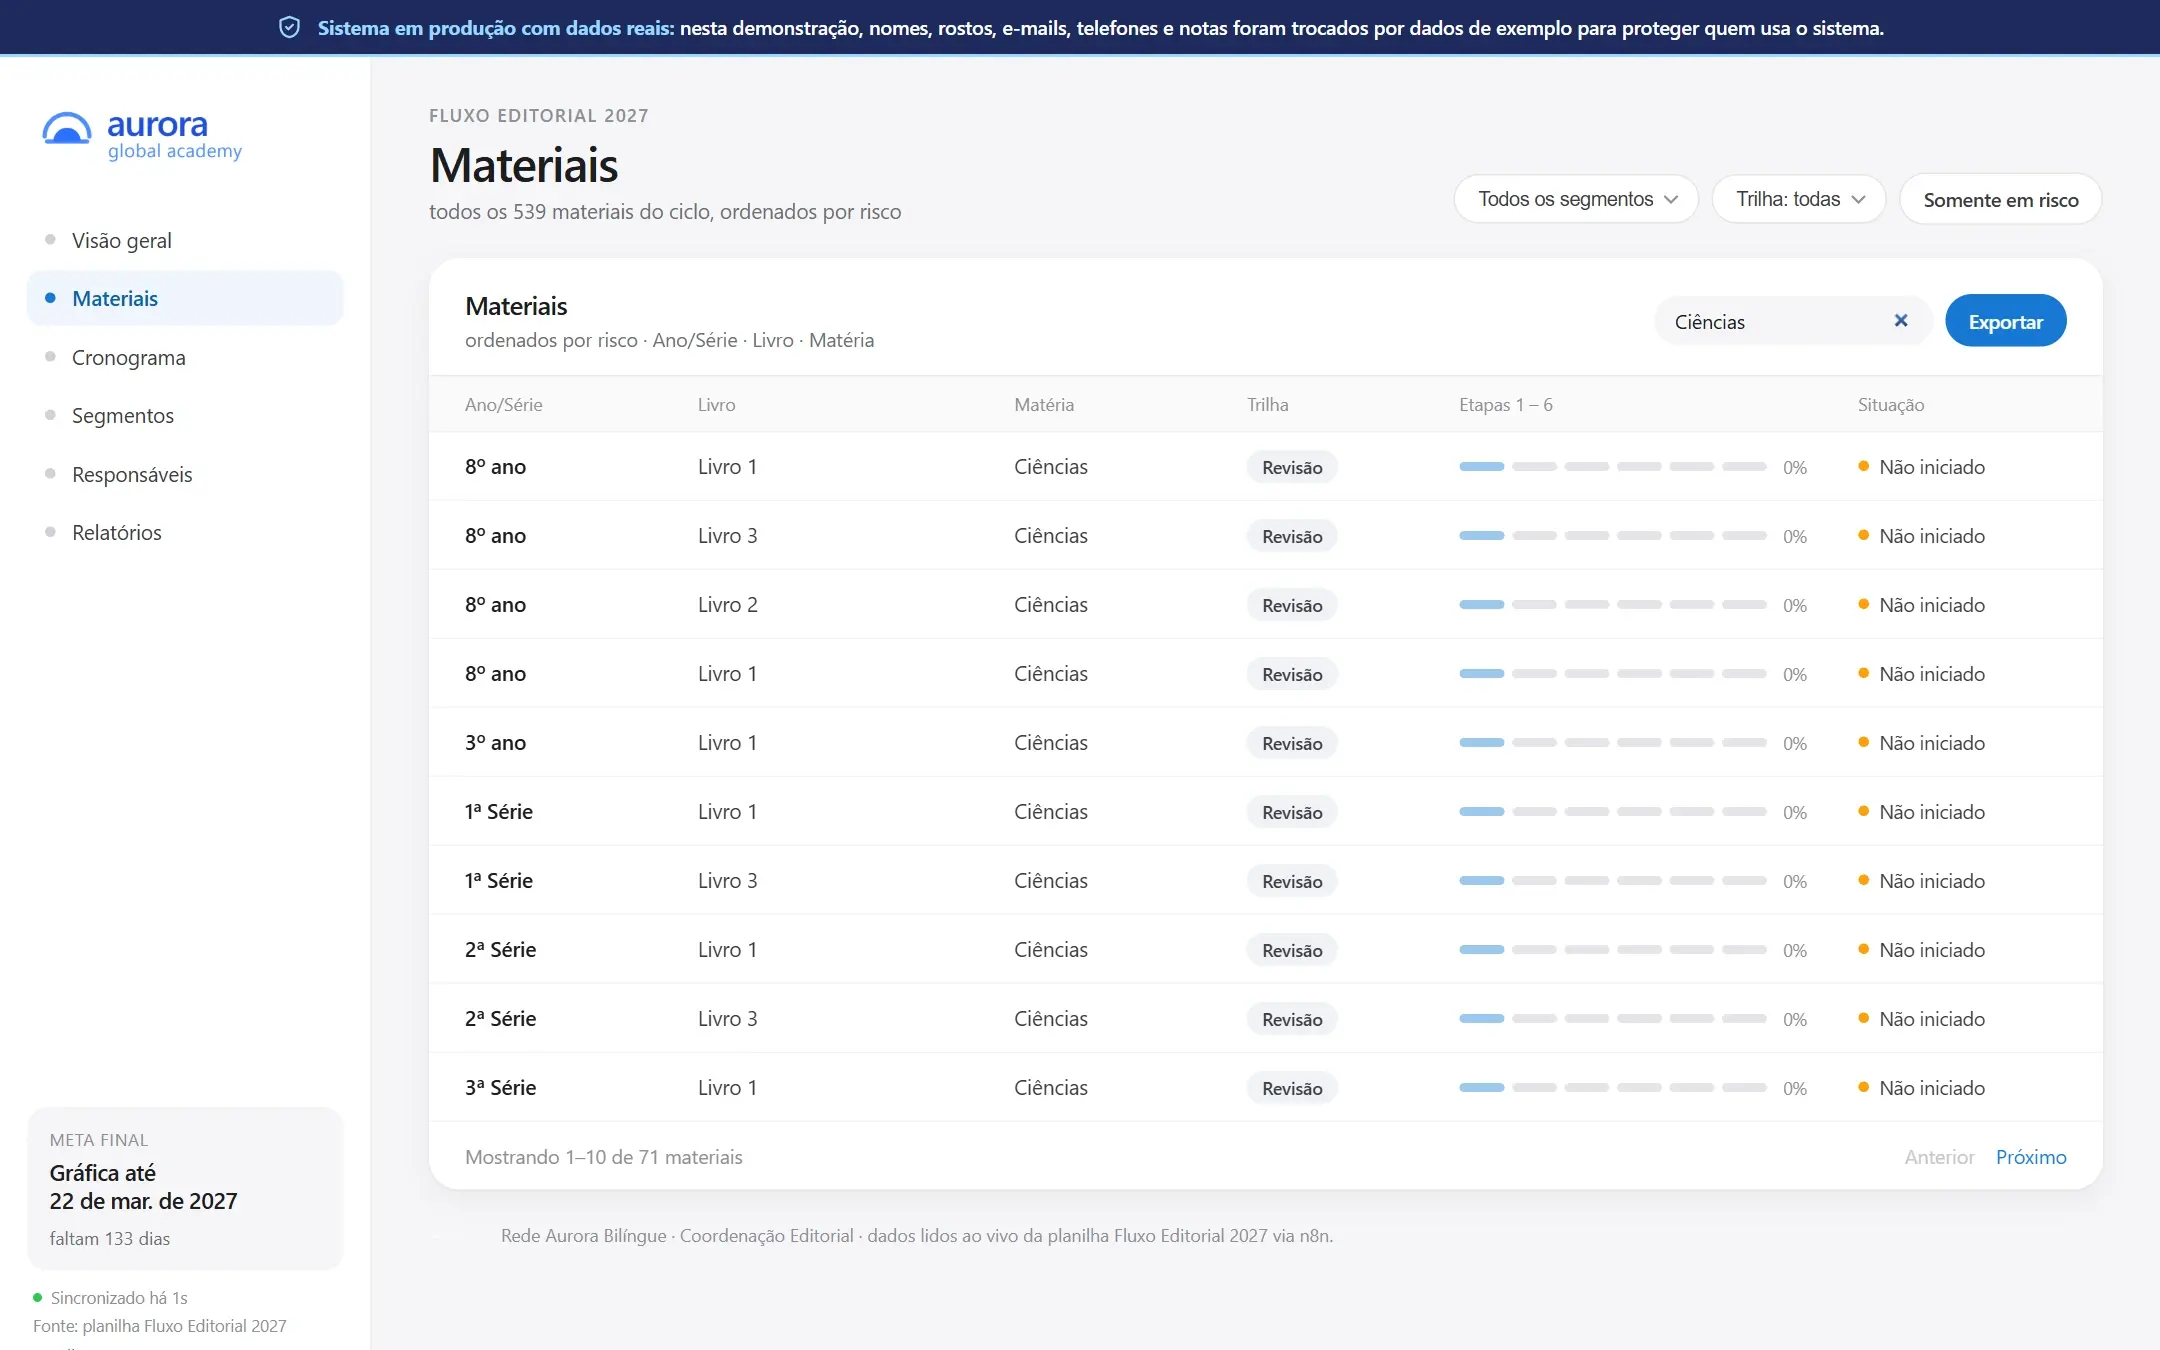
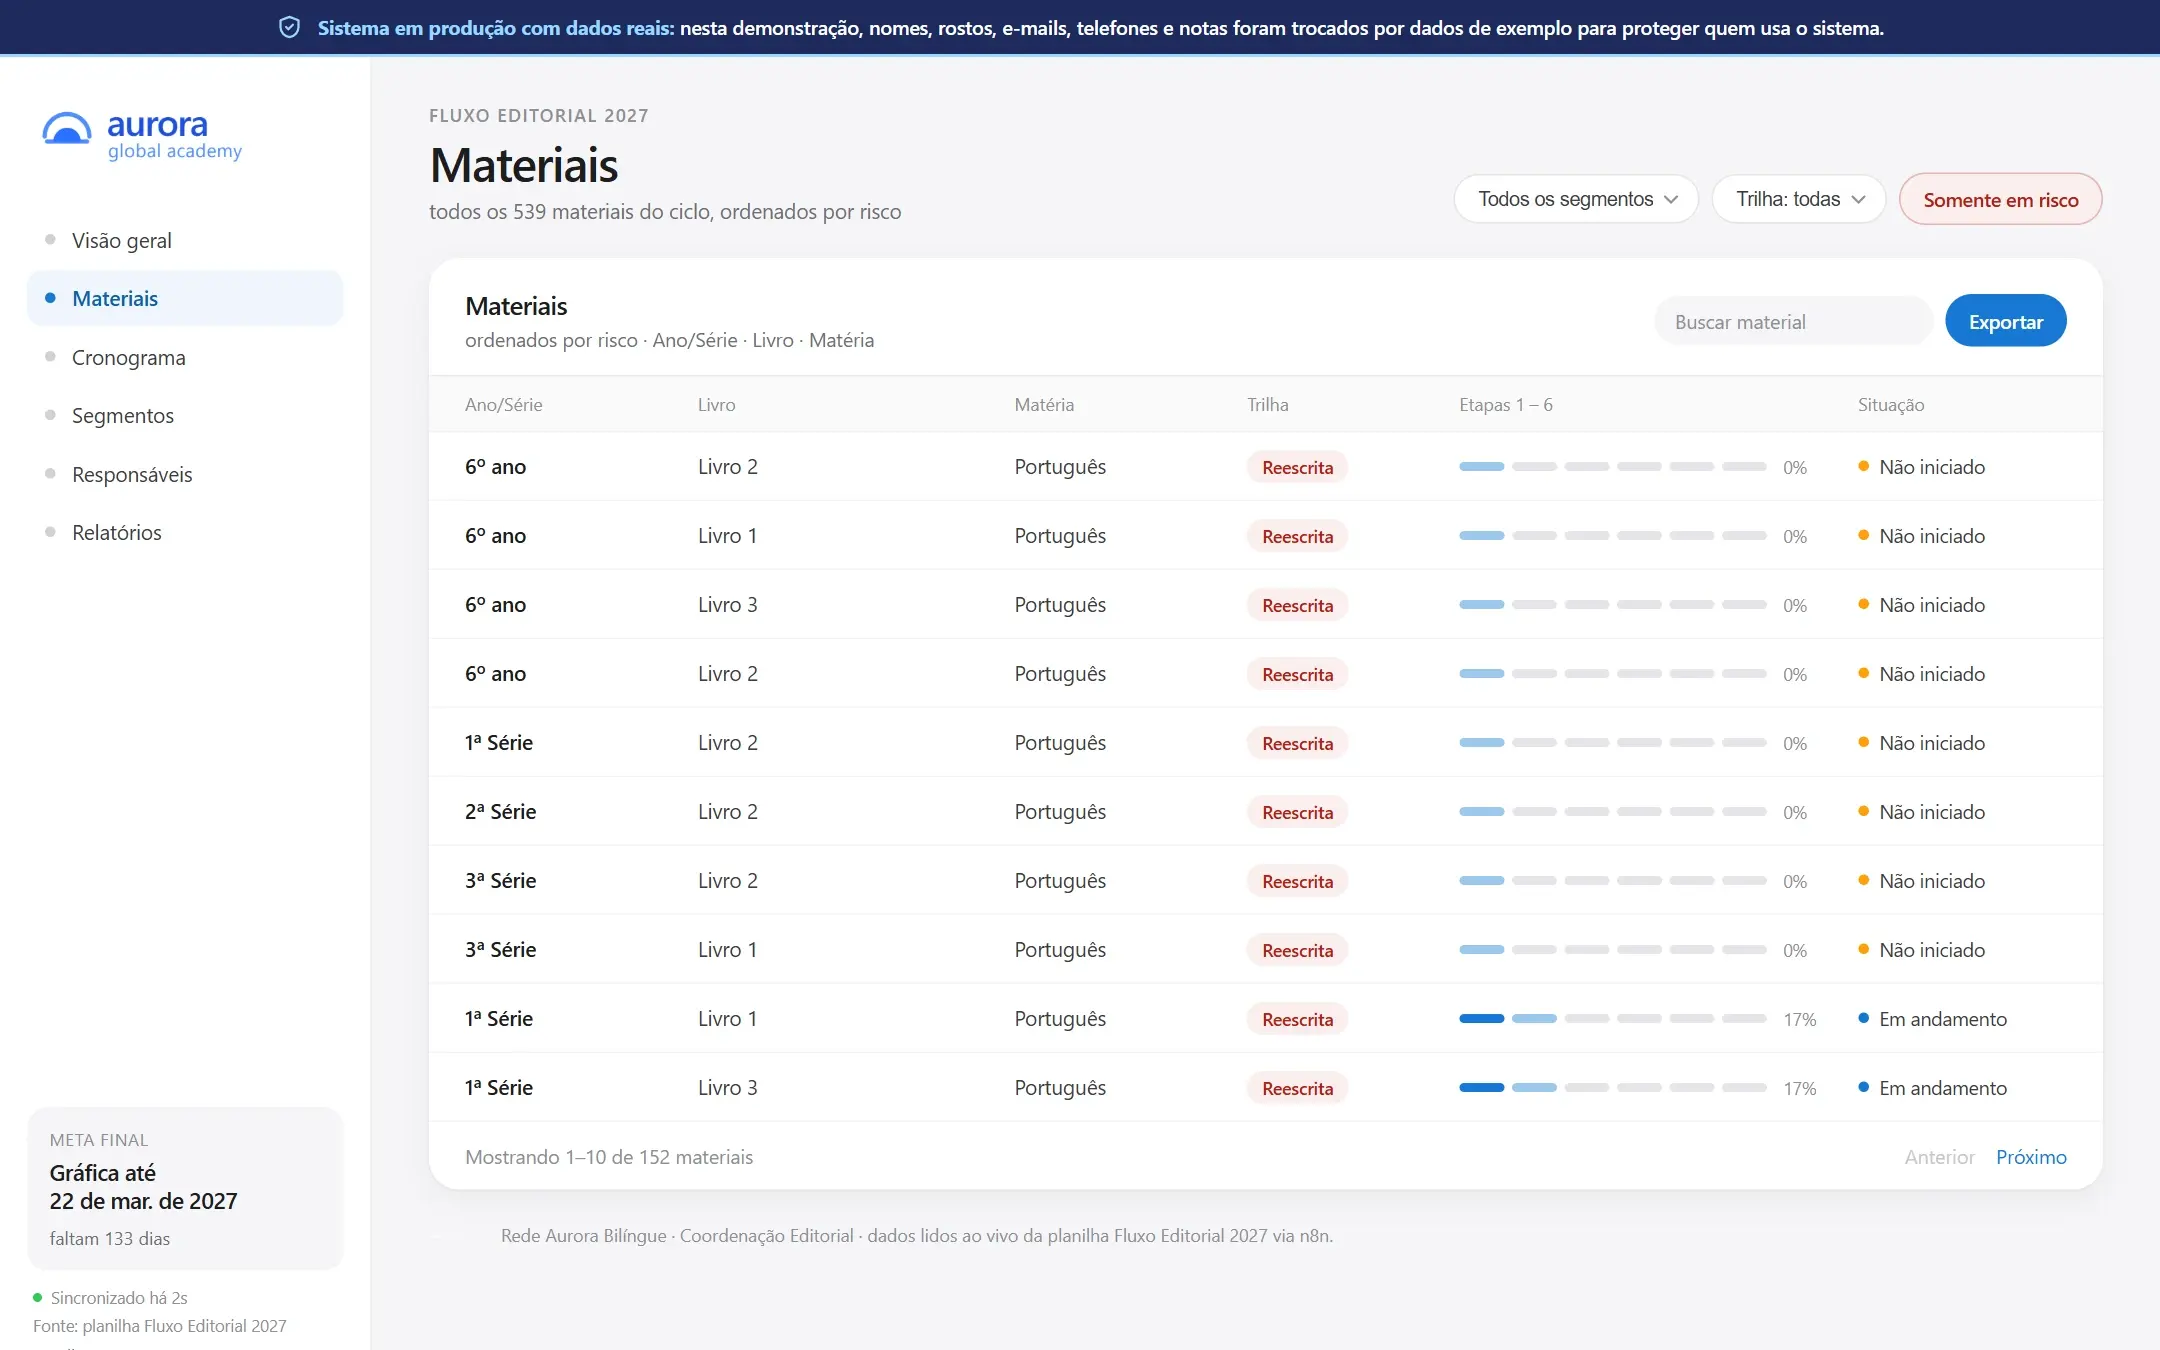
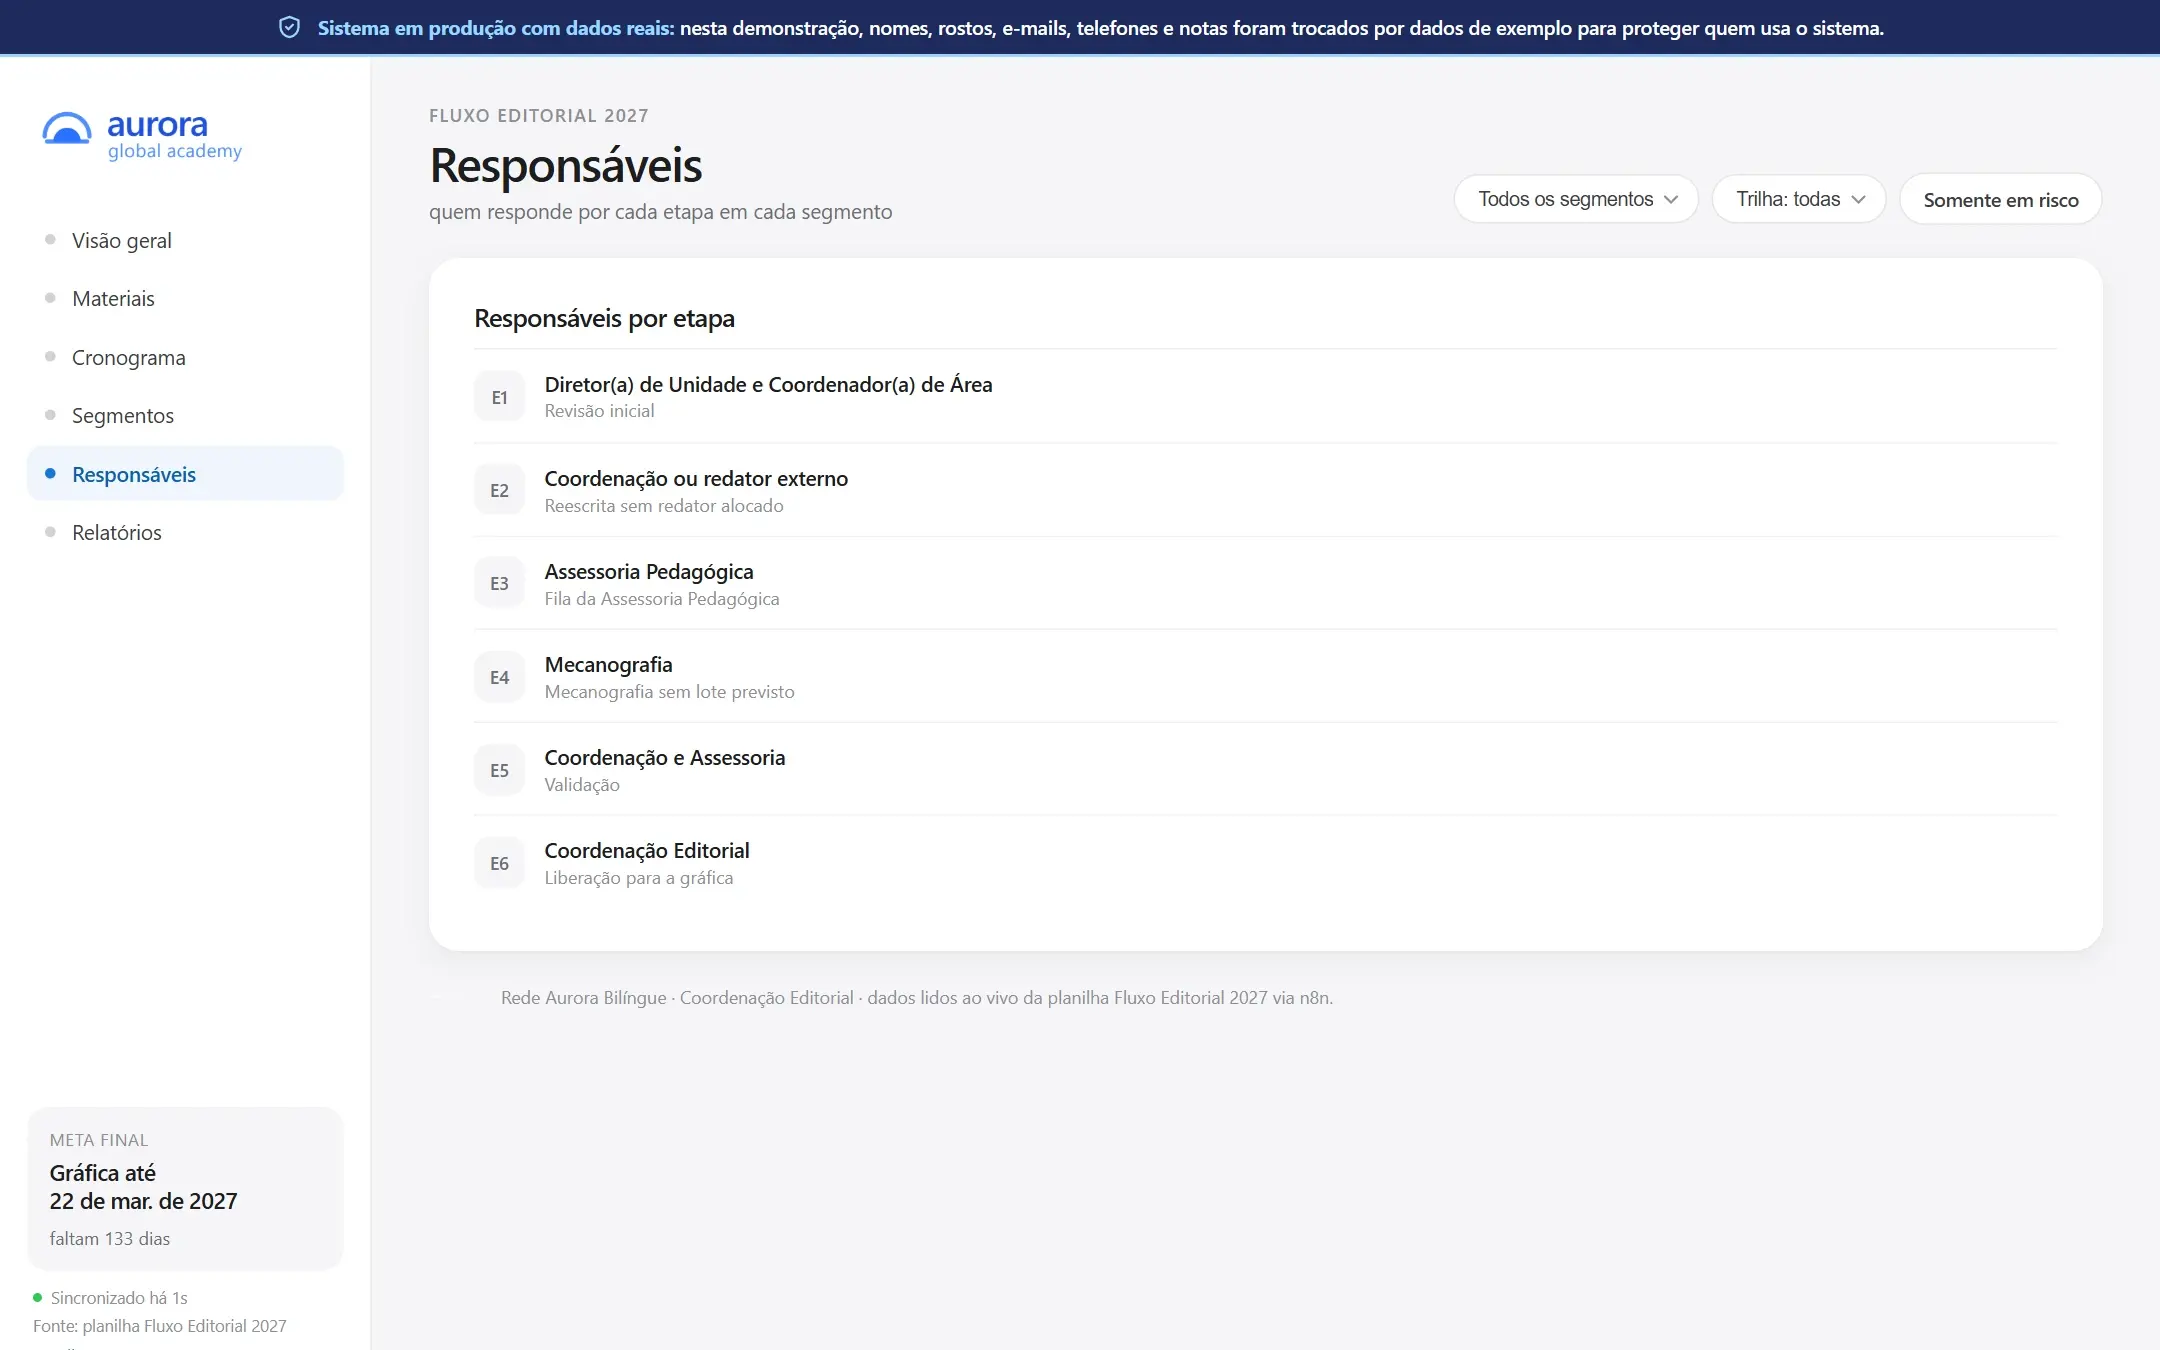
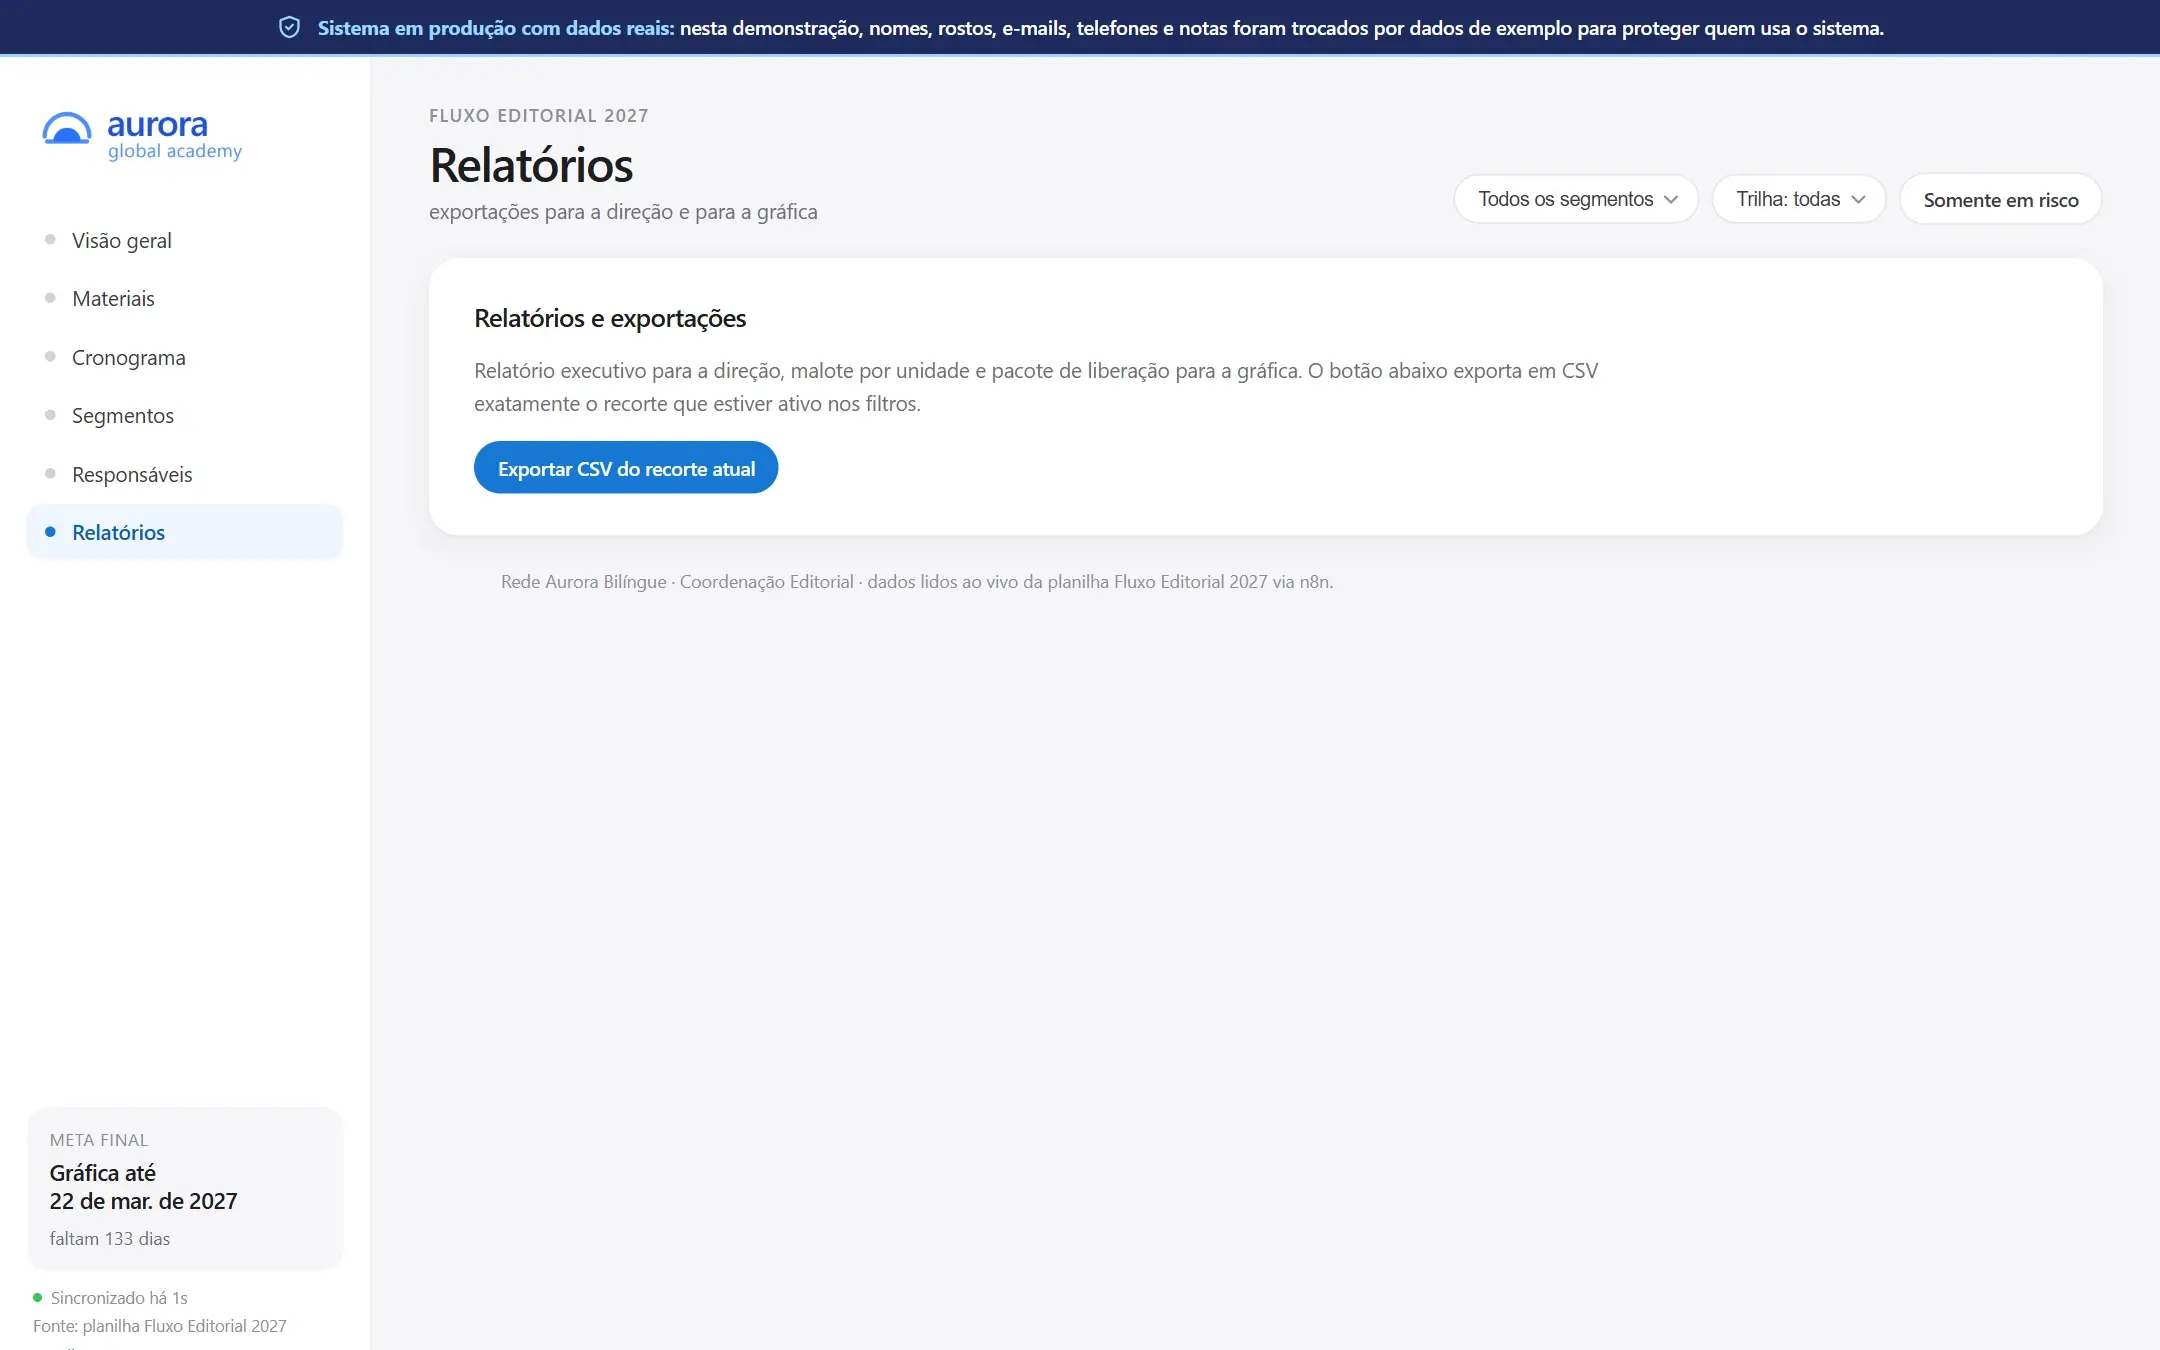
Not a single number hardcoded: change the spreadsheet, the dashboard follows. Leadership filters by school level, track and risk and exports the selection to a spreadsheet.
Tell me about today's problem. You get an answer within one business day.